
Measuring the Fiscal Sustainability of Public Pensions
NCPERS 2026 Research Report Finds Public Retirement Systems Are More Fiscally Sustainable Than They Have Been in Over Two Decades
 Public pensions are more fiscally sustainable today than they have been in over two decades, according to a research report from NCPERS analyzing state-level and national data from 2000 through 2024.
In Measuring the Fiscal Sustainability of Public Pensions, NCPERS analyzed more than 20 years of data to evaluate the relationship between long-term pension obligations and the economic capacity that supports them. The findings reveal significant progress nationwide, with 48 states now meeting or outperforming their historical sustainability benchmarks.
Download the ReportRead the Press Release
In 2022, NCPERS introduced sustainability valuation as a complement to actuarial valuation and other existing pension funding practices. The core idea: monitor the ratio between 30-year pension liabilities and 30-year personal income (upon which state and local revenues depend) and make moderate fiscal adjustments to keep that ratio stable at or below its historical average.
What Makes a Pension Fiscally Sustainable?
A pension’s liability is fiscally sustainable when it does not grow faster than the economy that supports it. Just as a 30-year mortgage should be gauged against 30-year income, 30-year pension liabilities must be assessed against 30-year economic capacity.
This updated research applies that test nationally and to every state for the years 2002 through 2024. Each state's average ratio over the full period defines what fiscal stability has historically looked like in that state. We call this its sustainability benchmark.
Download the report for insights into the fiscal health of public pensions today, or keep reading for key takeaways and state-by-state data.
The National Outlook For Pension Funding Continues to Improve
Nationally, pension liabilities relative to economic capacity have declined steadily in recent years. The report finds that the national sustainability ratio has remained below its long-term average for four consecutive years.
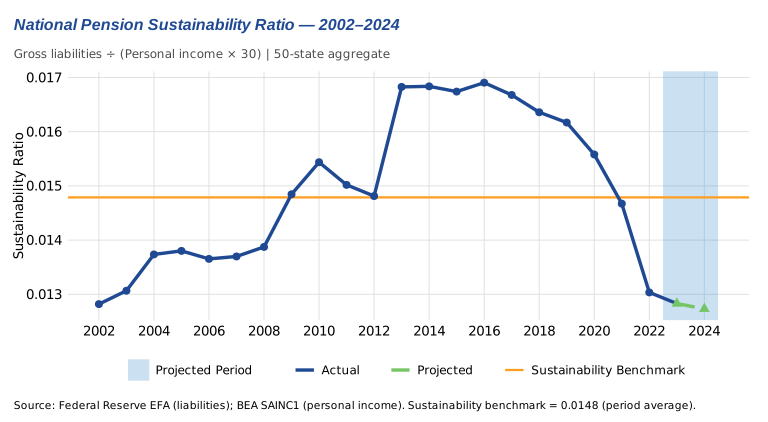 2002 · 0.01282 2003 · 0.01307 2004 · 0.01374 2005 · 0.01380 2006 · 0.01365 2007 · 0.01370 2008 · 0.01387 2009 · 0.01485 2010 · 0.01544 2011 · 0.01502 2012 · 0.01481 2013 · 0.01683 2014 · 0.01684 2015 · 0.01674 2016 · 0.01690 2017 · 0.01668 2018 · 0.01636 2019 · 0.01617 2020 · 0.01558 2021 · 0.01467 2022 · 0.01304 2023 · 0.01283 (proj.) 2024 · 0.01273 (proj.)
Public Pensions Are More Sustainable Than They Were Six Years Ago
The study finds that public pensions have become significantly more sustainable since the original NCPERS sustainability analysis. In 2018, 45 states had pension liabilities growing faster than their economies. Today, that number has fallen to just two.
Join us Tuesday, September 15, 2026 for our webinar: State Budgets & Public Pensions: What to Watch in the Next Budget Cycle.
48 States Are at or Below Their Sustainability Benchmarks
The research evaluates each state’s pension obligations against its own historical sustainability benchmark. As of 2024, 48 states are at or below those benchmarks, representing the strongest overall position in more than 20 years.
Even the Most Stressed States Have Made Progress
Illinois, the original study's most prominent example of fiscal sustainability challenges, spent twelve consecutive years above its sustainability benchmark from 2010 through 2021. In 2022 it crossed back below that benchmark for the first time in over a decade, and it remains below it today.
State-by-State Sustainability Analysis, 2002–2024
Explore the interactive map below to see how your state measures up. Click on your state to download a PDF that includes:
- 30-Year Pension Liability to 30-Year Personal Income: This chart shows the annual sustainability ratio alongside the state’s sustainability benchmark (its long-run average ratio). Years in which the ratio exceeds the benchmark indicate periods of above-average stress.
- 20-Year Bonded Debt to 20-Year Personal Income: For each state, the bonded-debt ratio figure covers 2004–2022, the window of available Census of Governments long-term debt data.
Map shading shows the amount needed to stabilize each state’s ratio as a share of annual personal income. Sources: Federal Reserve EFA (liabilities); BEA SAINC1 (personal income).
Questions? Contact research@ncpers.org.