
Closing Loopholes in Investment Policy Statements
By: Eric Friedman and Katie Comstock, Aon
The article examines how multi-layer asset allocation ranges can help institutional investors close unintended risk gaps in their investment policy statements. Aon’s review of public pension investment policy statements found an even split between single-layer and multi-layer asset allocation ranges, despite the fact that single-layer approaches can allow significant risk drift without violating policy.

Aon recently completed a study of the investment policy statements of the 50 largest public pension funds in the U.S., reviewing those that are publicly available to assess the prevalence of various characteristics.1 One of the most interesting findings is that these plans are roughly evenly split between those that use single-layer asset allocation ranges and those that use multi-layer ranges — despite the fact that these two approaches can lead to meaningfully different risk outcomes. In practice, multi-layer ranges often provide stronger risk control and clearer governance, whereas single-layer ranges can allow total equity or total illiquid exposure to drift far from policy intent without technically violating policy. We have also found that many investment professionals have not considered the difference between single- and multi-layer asset allocation ranges, leading us to wonder how intentionally plans choose between single or multi-layer ranges.
Defining Single- and Multi-Layer Asset Allocation Ranges
The distinction is best illustrated through a simple example. The following exhibit shows two versions of the same target allocation: one with single-layer ranges around the target allocation (on the left) and the other with multi-layer ranges:
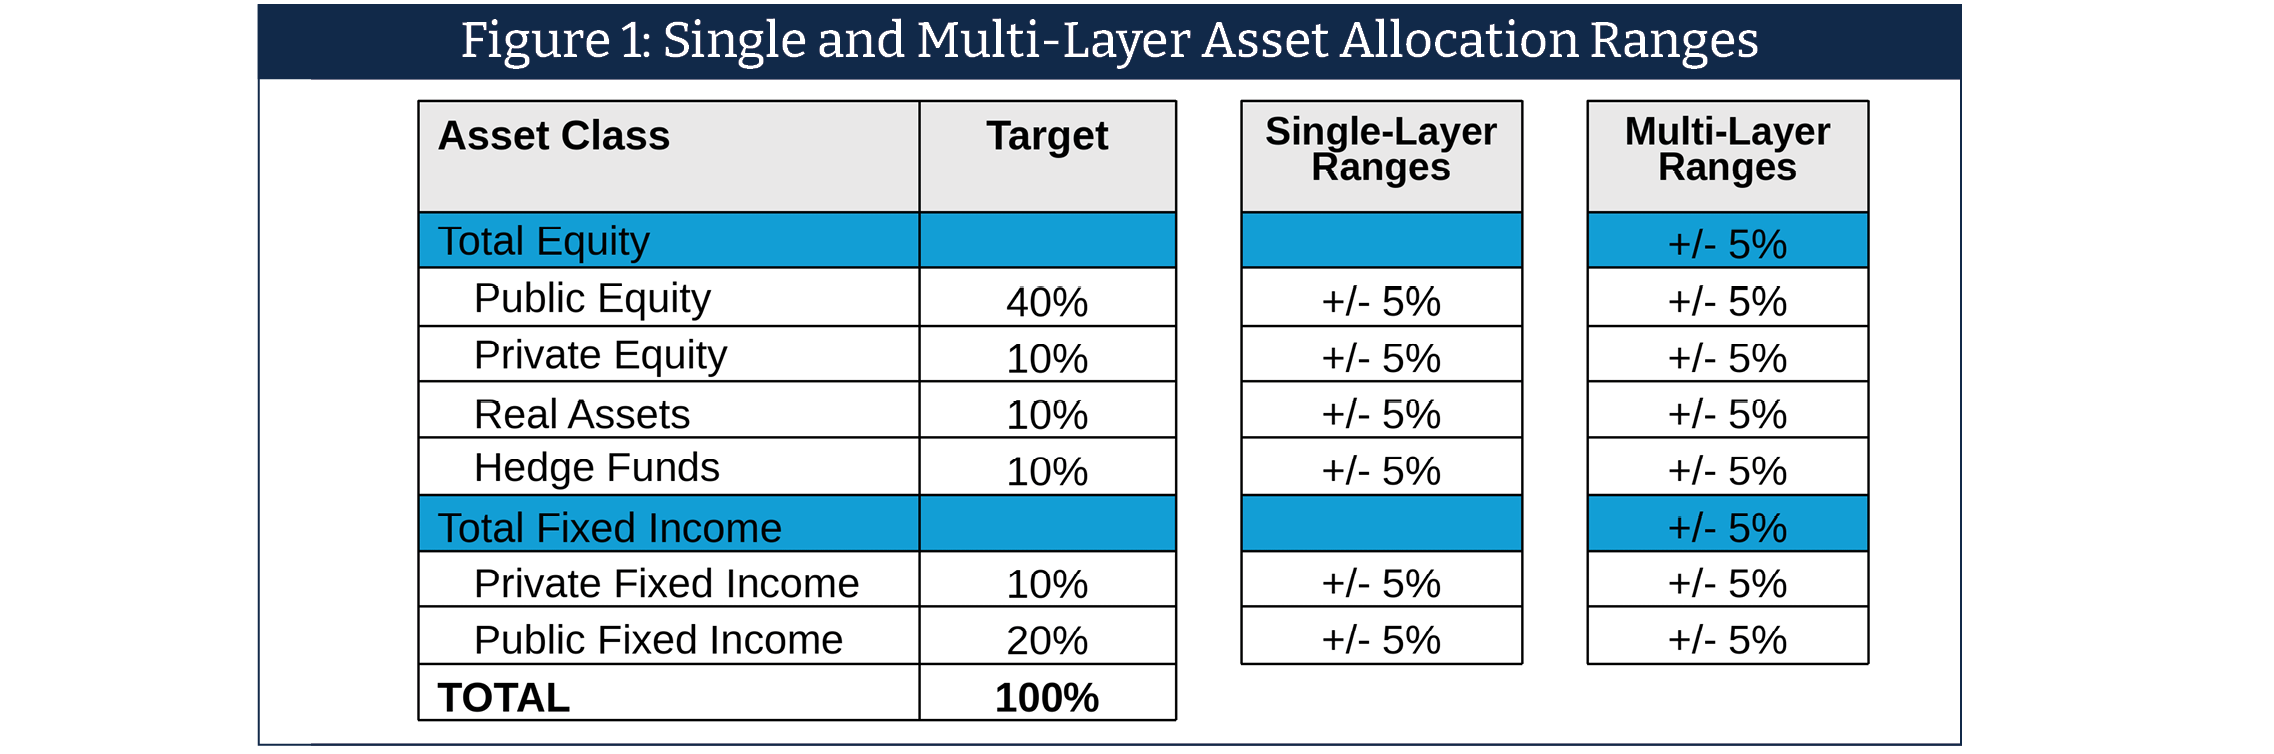
In the multi-layer example, the inclusion of a separate “Total Equity” range prevents the portfolio from simultaneously reaching the maximum (or minimum) allocation for both public and private equity. This additional constraint helps ensure that total equity exposure remains consistent with policy intent, even as allocations shift within equity sub-segments. The multi-layer asset allocation range has a similar structure for fixed income. For many investors, multi-layer ranges offer better risk control and align the investment policy with how the portfolio is intended to be managed.
When are Multi-Layer Ranges Most Valuable?
Multi-layer ranges are most valuable when investment policies assign separate targets to closely related asset classes — for example, multiple categories of public equity alongside private equity. If each category has its own single-layer range, the portfolio could simultaneously sit at the top (or bottom) of every range, resulting in an overall exposure that differs materially from the intended target.
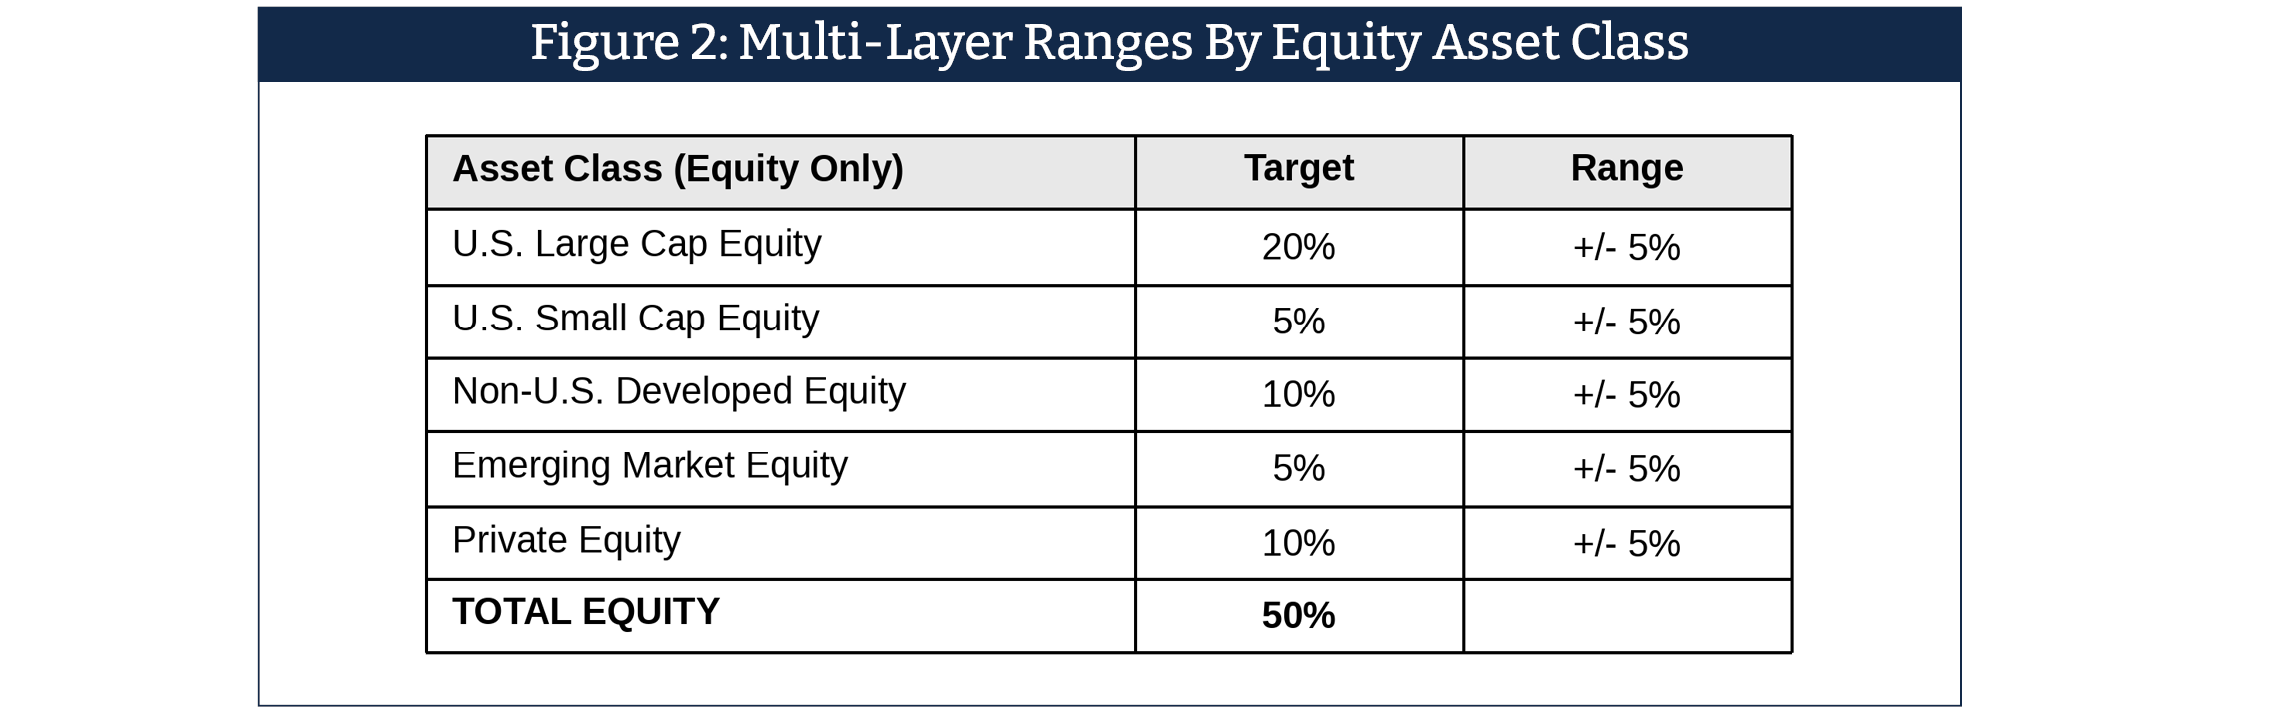
The following table has an example, showing just the equity asset classes. While this portfolio has a target allocation to all forms of equity totaling 50%, a single-layer range structure could allow equity to drift from as low as 25% to up to 75% without technically violating the policy. Most institutions do intend to provide this much flexibility.
A similar issue arises when portfolios include multiple types of alternative investments. In these cases, multi-layer ranges can help manage total portfolio liquidity by preventing all illiquid allocations from simultaneously drifting to the upper end of their individual ranges. In other words, single-layer ranges can allow total equity or illiquid exposure to drift far from policy intent without technically violating policy.
Conclusion
A good investment policy statement should be aligned with how the institution intends to manage the portfolio. Multi-layer asset allocation ranges help align the written investment policy statement with how institutional portfolios are actually managed in practice — providing clearer guardrails around aggregate risk, liquidity, and governance intent — without adding unnecessary complexity. Yet under half of the 50 largest U.S. public pension plans have multi-layer asset allocation, and we believe that many others can consider this as an opportunity to enhance their governance and risk management.
About the authors: Eric Friedman is a Partner with Aon’s Investment Analytics & Strategy Development team in the U.S. In his role as the Head of Thought Leadership, he leads the firm’s U.S. efforts in developing intellectual capital to improve its investment advice to institutional investors. Eric holds the designations of Fellow of the Society of Actuaries, Enrolled Actuary, and Chartered Financial Analyst.
Katie Comstock is a Partner and leads public sector solutions at Aon Investments USA. Katie consults to state and local public entities on governance, investment policy, asset-liability analysis, asset allocation, risk budgeting, and portfolio structure, helping public sector organizations achieve their investment objectives.
Disclosures: This article is a general communication being provided for informational purposes only. The opinions expressed represent the current, good-faith views of the author(s) at the time of publication. It is not designed to be investment advice or a recommendation of any specific investment product, strategy, or decision, and is not intended to suggest taking or refraining from any course of action. Any forward-looking statements, estimates, and certain information contained herein, are based upon research and other sources that are subject to change. The information provided relates to Aon Investments USA Inc. (“Aon Investments”). Aon Investments is wholly owned by ACI, an indirect subsidiary of its ultimate parent, Aon plc. Aon plc is a diversified professional services company, and such services are provided through various subsidiaries and/or affiliates. Investment advice and investment consulting services provided by Aon Investments.
Endnotes:
1. Source: Aon study of Investment Policy Statements of the 50 largest U.S. public pension funds. Data is only for public funds with Investment Policy Statements available online or through information requests to the fund. The study only used publicly available data. Data as of 8/2025.