Lower Middle-Market Direct Lending: A Source of Alpha and Low Market Correlation with Potential Tax
By: Brett Hickey, Star Mountain
This article discusses the current state of U.S. private debt and how the lower middle-market can offer a differentiated and diversifying opportunity defined by inefficiency, stronger covenants, and more conservative leverage structures.

Executive Summary
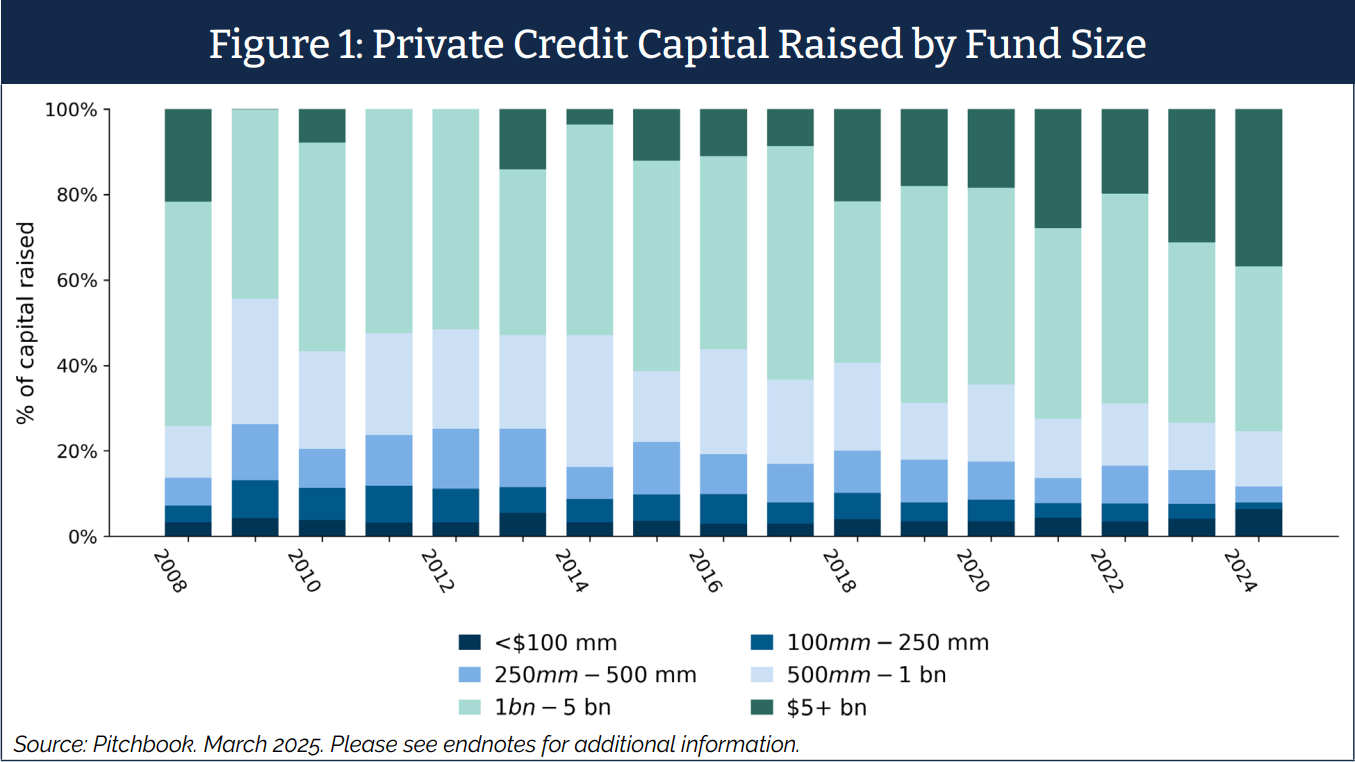
Private credit is among the fastest-growing segments of private markets.1 The same forces that fueled its expansion such as abundant liquidity, investor demand for yield and record fund sizes are now reshaping risk and return.1 In the larger market, heavy inflows have intensified lender competition, compressing spreads, weakening covenant protection, and encouraging higher leverage.2,3
By contrast, lower middle-market (“LMM”) established businesses typically generating $10–500 million in annual revenue remain less trafficked, less efficient, and more labor intensive. Limited inflows have helped preserve underwriting discipline, supporting stronger covenants, more conservative leverage, and better alignment between investors and business owners.3,4
This supply-demand imbalance positions the LMM as an attractive portfolio diversifier and source of alpha. While company-specific risk may be higher in the LMM, disciplined underwriting and active management can convert inefficiencies into long-term opportunity.
Capital Concentration
Private credit has become a highly concentrated institutional market. In 2024, more than three quarters of commitments flowed to the 25 largest funds, and by early 2025, the top 10 managers captured over 85% of new inflows.1 This concentration risks prioritizing rapid deployment over underwriting rigor and structural protection.
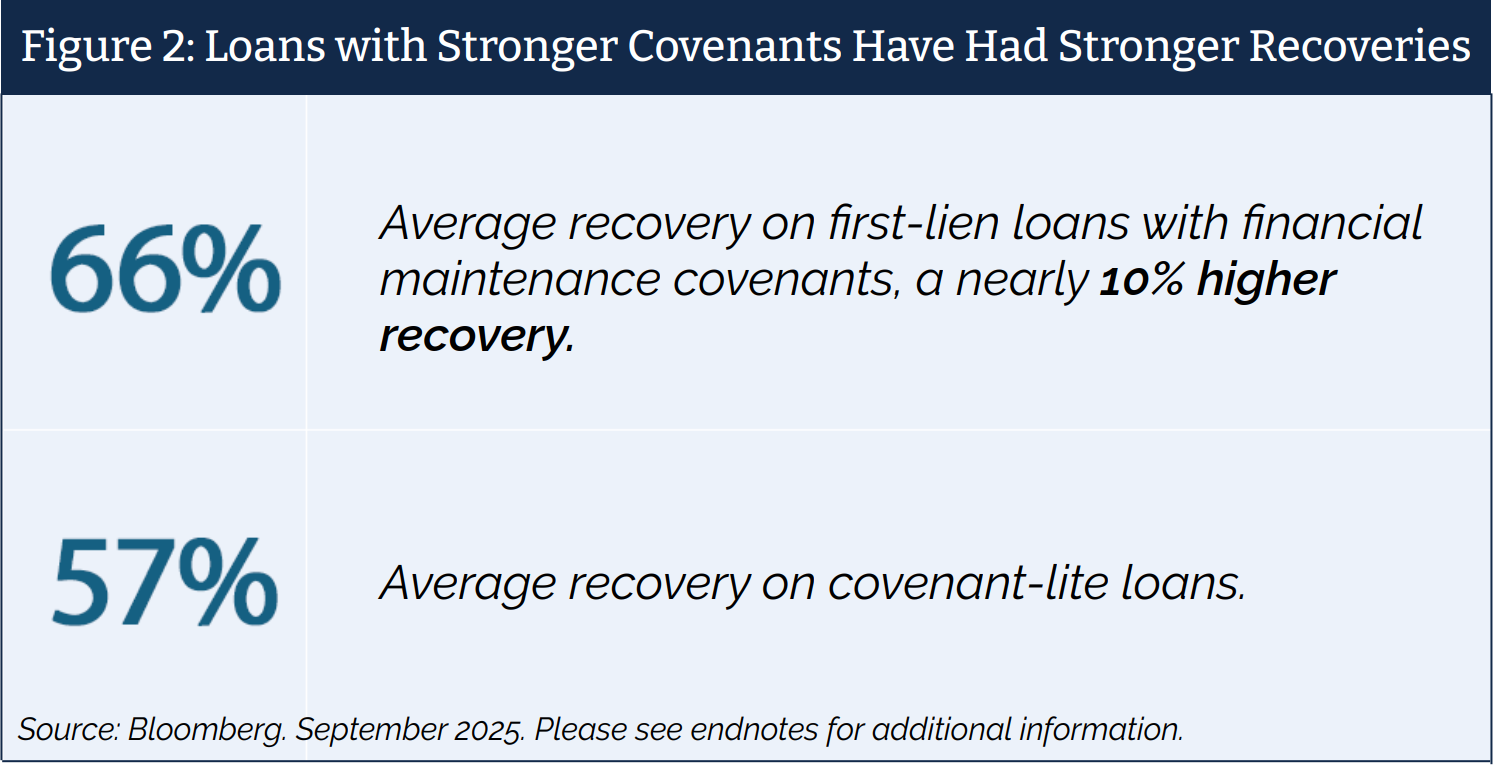
Nearly 90% of newly issued institutional loans are now covenant-lite, eliminating financial maintenance tests that once served as early warning mechanisms.5 Loans with maintenance covenants have historically demonstrated lower loss rates and stronger recoveries.6
Aggressive EBITDA adjustments can obscure true leverage and contribute to higher losses when performance weakens.5,6 As spreads in larger segments approach pre-crisis levels, investors are receiving less incremental return for materially higher structural risk, reinforcing the appeal of less crowded, more conservatively structured markets in the LMM.7
For investors seeking diversification and alpha, opportunity now lies where inefficiency persists and competition remains limited.
Contrast to the Larger Market, Limited Supply, and Growing Demand in the LMM
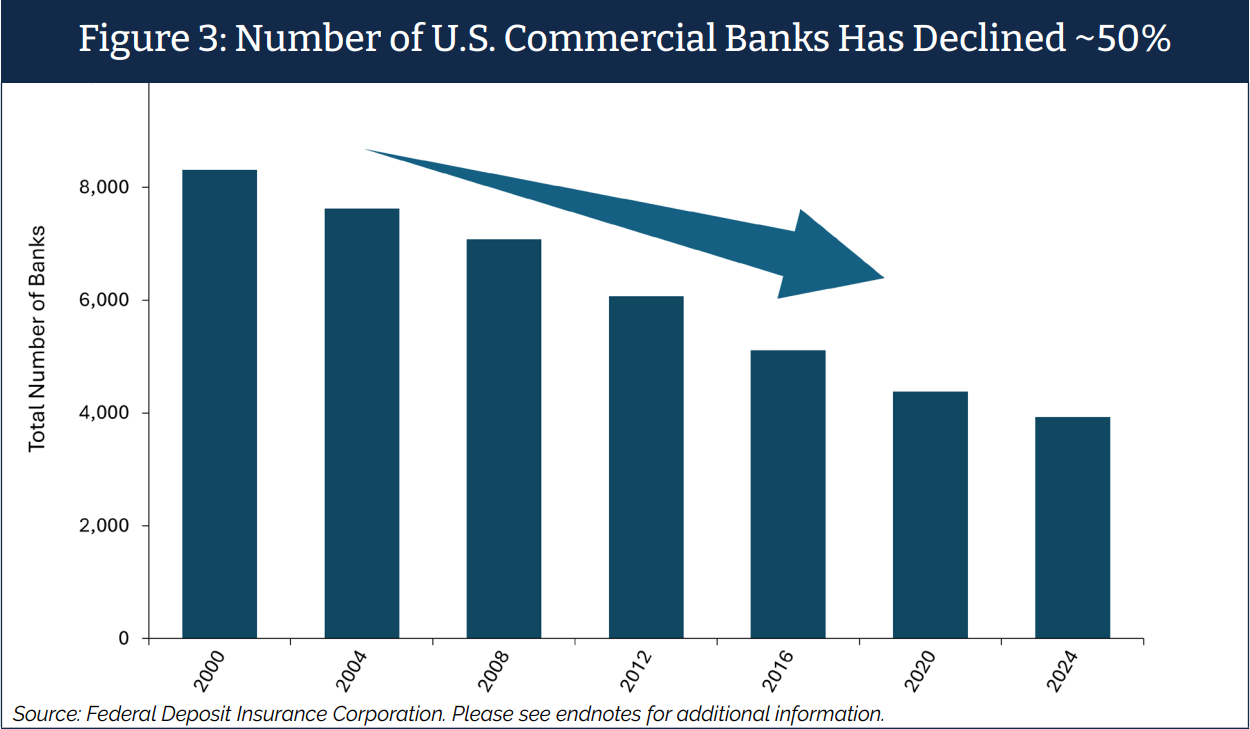
Over the past two decades, the number of U.S. commercial banks has declined by nearly half, reducing lending capacity for smaller businesses.8 At the same time, the U.S. population aged 65+ is at a historic high, accelerating ownership transitions.9,10 As more founder-owned businesses prepare for succession or recapitalization, demand for bespoke capital solutions continues to grow.11 Together, declining capital supply and rising borrower demand reinforce the LMM as a durable source of yield, diversification, and long-term value creation.12
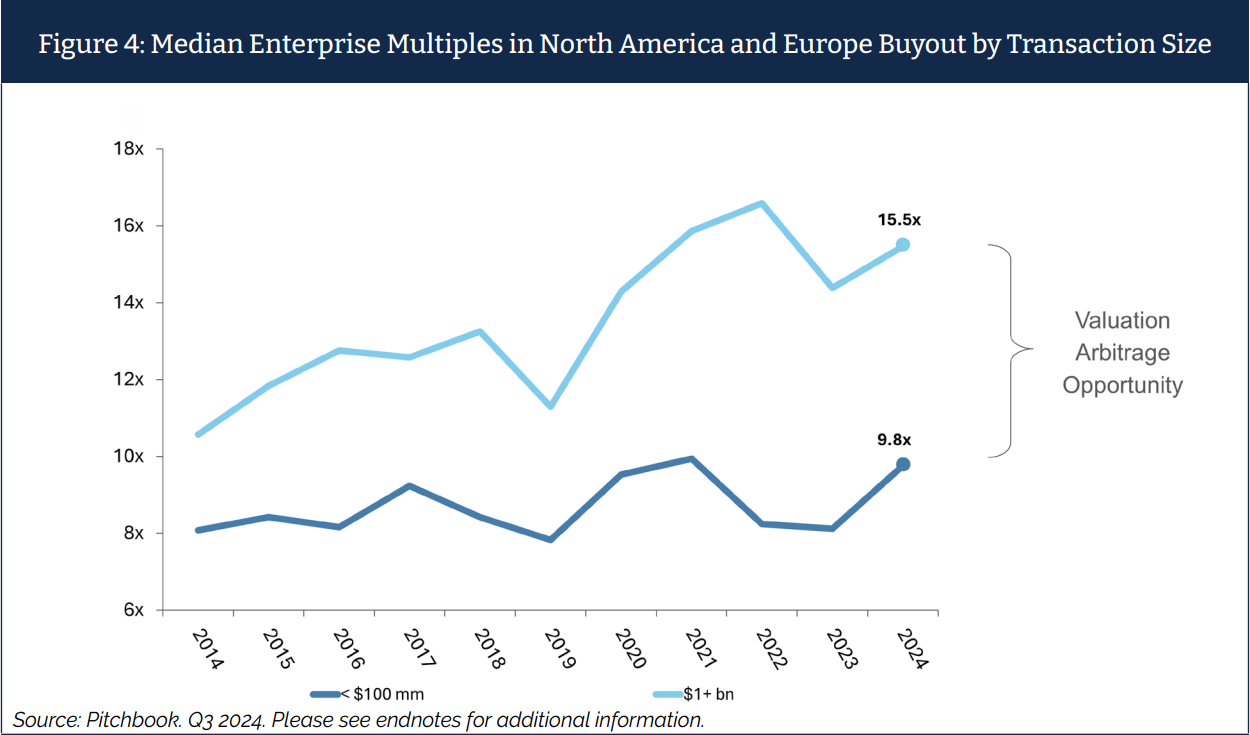
Valuation Arbitrage in LMM
A key advantage of the LMM is valuation arbitrage. As companies grow from the LMM into the broader middle-market, enterprise values often expand as they attract a wider set of buyers and lenders.13
The market remains relationship-driven rather than commoditized: founder and family-owned businesses often prioritize long-term alignment, and limited intermediation by large investment banks can support premium spreads and stronger terms.
LMM Credit Performance
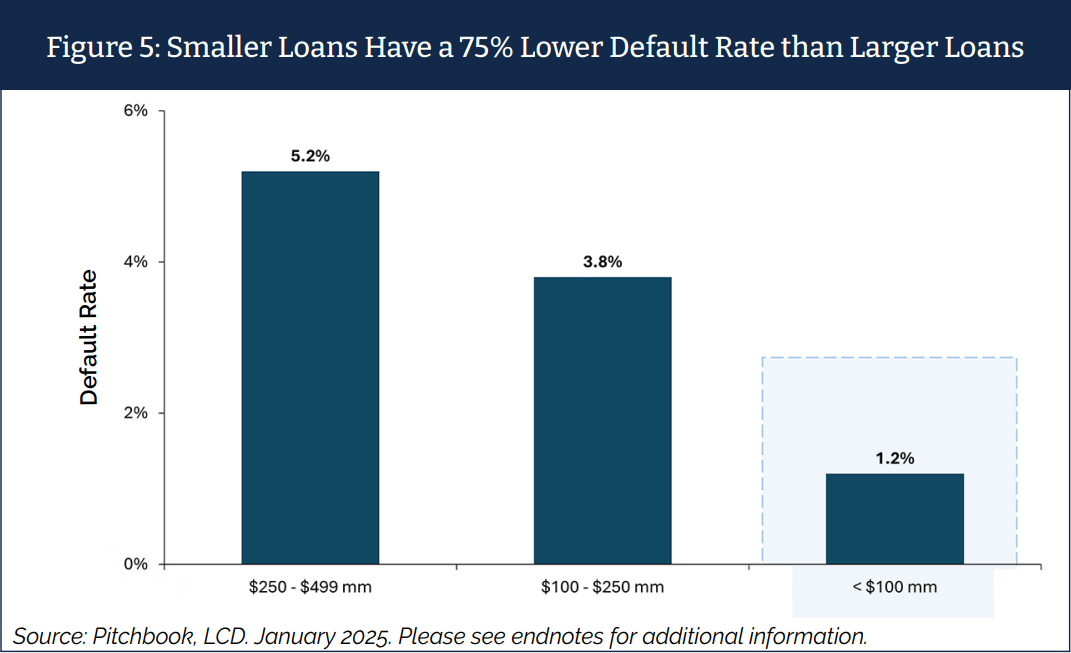
Historical performance data highlights the structural advantages of disciplined lending within the LMM. Over nearly three decades of observed data, smaller loans have demonstrated meaningfully lower default rates than larger institutional credits.
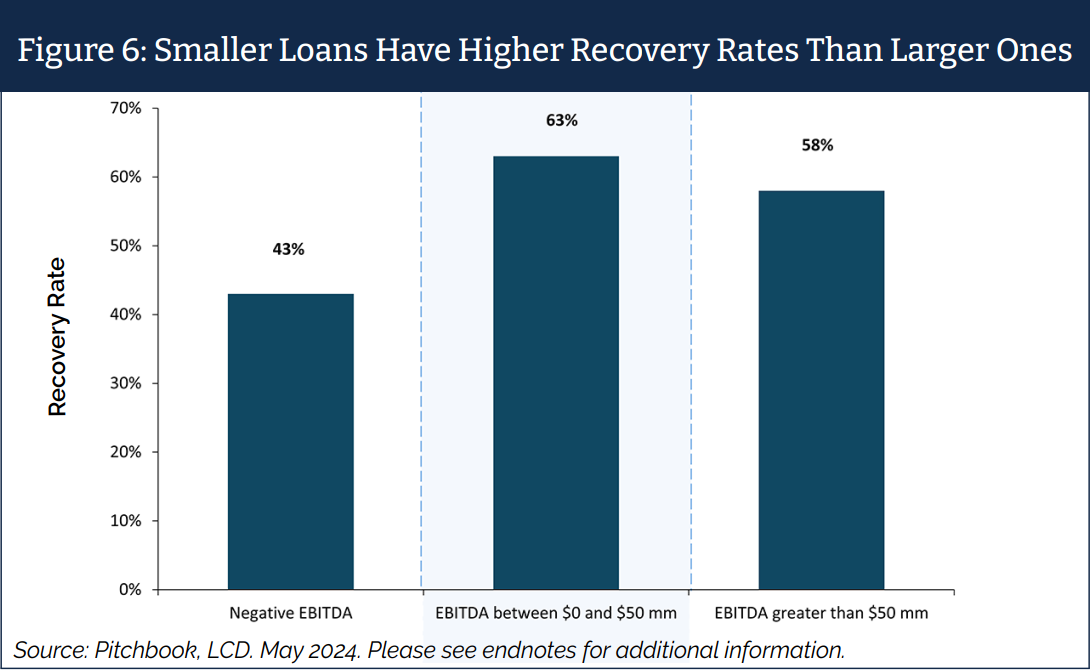
Smaller loans have also delivered consistently higher recovery outcomes, reinforcing the durability of the LMM approach.
Conservative capital structures and stronger lender protections have helped preserve value even during periods of market stress, contributing to long term portfolio resilience and attractive risk adjusted returns.
Conclusion
The LMM offers compelling opportunities within private credit for investors seeking diversification and consistent alpha generation. Limited capital inflows and labor-intensive investing create inefficiencies that reward disciplined underwriting and active management.
As the broader market grows more concentrated, competition in larger segments has driven tighter spreads, weaker covenants, and increased leverage.8,14,15 By contrast, shrinking capital supply and rising borrower demand in the LMM support stronger lender protections, better alignment of interest, and more stable yield per unit of risk across economic cycles.9,11
About the author: Brett Hickey, Chief Executive Officer, has ~25 years of asset management and U.S. LMM investment experience. Prior to launching Star Mountain Capital, Mr. Hickey was the Co-Founder and President of a multi-manager platform including 4 U.S. state sponsored small business investment funds. Mr. Hickey has extensive experience performing due diligence on, selecting, and building small business fund managers and has helped structure over a dozen larger funds representing a few billion dollars in assets.
Mr. Hickey formerly worked as an Investment Banker at Citigroup Global Markets in New York City (fka Salomon Smith Barney) where he covered global Asset Managers and Financial Institutions, analyzing and advising on the buying and selling of $18 bn of assets / asset managers.
Mr. Hickey has held numerous advisory and board member roles including the global advisory council of the Harvard Alumni Entrepreneurs and the Board of Directors of the Foreign Policy Association.
Disclosures: This article is provided for informational and educational purposes only and does not constitute an offer to sell, or a solicitation of an offer to purchase, any security or investment product managed or advised by Star Mountain Fund Management, LLC (“Star Mountain”). The information herein reflects the views and market observations of Star Mountain as of the date of publication and is subject to change without notice. This content is not intended as investment, legal, accounting, or tax advice, and prospective investors should consult their own professional advisors. The information herein may include data derived from third-party sources believed to be reliable, but Star Mountain makes no representations as to its accuracy or completeness. This content may be shared publicly but should not be reproduced or redistributed without written permission from Star Mountain.
Certain Risks of Investment
Investments in private funds, including LMM private credit funds, involve significant risks, including the risk of loss of capital. These investments are illiquid, speculative, and not subject to the same regulatory requirements as mutual funds or other registered investment products. There is no assurance that investment objectives will be achieved, and past performance is not indicative of future results. Statements regarding default rates, recovery rates, or structural protections in the LMM credit space are based on historical data and should not be interpreted as guarantees. Any investment should be made only after a careful review of the relevant offering documents and consultation with independent advisors.
Endnotes:
1PitchBook Data, Inc. Private Credit Capital Raised by Fund Size. March 2025.
2S&P Global. U.S. Leveraged Finance and BSL CLO Quarterly Q3 2025. August 2025.
3S&P Global and Moody’s Analytics. CLO Obligor Upgrade and Downgrade Data. 2022–2025.
4PitchBook LCD. U.S. Institutional Loan Activity Report. September 2025.
5PitchBook LCD. U.S. Leveraged Loan Quarterly Trend Lines. Q3 2025. Institutional loans consist of term loans structured specifically for institutional investors, including CLOs.
6PitchBook LCD, Moody’s Analytics, and Bloomberg. Recovery Rates by Covenant Structure and Private Equity Loans on Weaker Credit Safeguards. March–September 2025.
7Federal Reserve Economic Data (FRED). ICE BofA U.S. High Yield Index Option Adjusted Spread. October 2025.
8Federal Deposit Insurance Corporation (FDIC). Quarterly Banking Profile. 2025.
9SBA Office of Advocacy. 2014.
10United States Census Bureau. Older Adults Outnumber Children in 11 States and Nearly Half of U.S. Counties. June 2025.
11U.S. Census Bureau. Population Estimates and Demographic Trends. 2025.
12PitchBook LCD and Moody’s Analytics. Default and Recovery Rates by Loan Size. March 2025.
13Federal Reserve Economic Data (FRED). U.S. High Yield Market Spreads and Credit Cycle Indicators. October 2025.
14JPMorgan Asset Management. Guide to Alternatives: U.S. Commercial and Regional Bank Lending Mix. Q4 2023.
15PitchBook Data, Inc. U.S. Private Company Deal Volume by Year. March 2025.
16PitchBook. Allocator Solutions: Private Market Opportunities. Q3 2024.
17PitchBook LCD. January 2025. Default rates by original loan size bucket of less than $100 mm (1.20%), $100 mm to $250 mm (3.80%), and $250 mm to $499 mm (5.20%), with default rate definitions and measurement periods per LCD methodology.
18PitchBook LCD. May 2024.