By: Joanna Bewick and Christopher Tessman, Wilshire
Pension fund investors can learn that while the 60/40 portfolio showed strong performance in 2024 due to a booming equity market, it is important not to underestimate the enduring benefits of diversification over the long term. By spreading risk and capturing returns across various asset classes, diversified portfolios can offer better resilience and potentially higher returns, making them a sound long-term strategy despite their complexity and higher fees.

This is an excerpt from NCPERS Summer 2025 issue of PERSist.
The 60/40 portfolio, a classic investment strategy comprising 60% equities and 40% bonds, delivered a remarkable 11.12% return in 2024. This robust performance, driven largely by a booming U.S. equity market, has led some to question the merit of more diversified portfolios, particularly given their greater complexity and often higher fees.
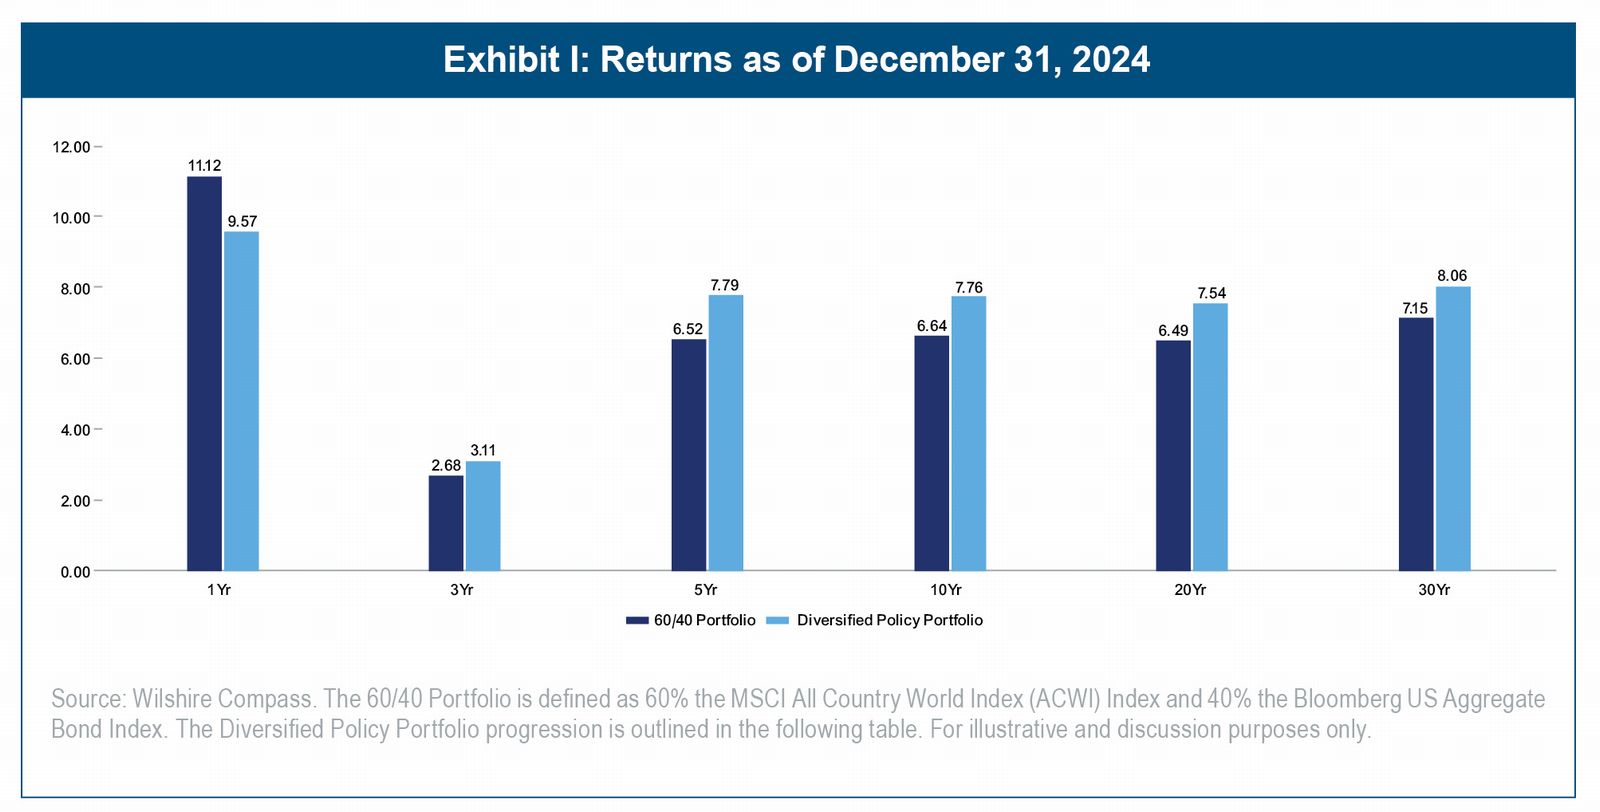
Overemphasizing one-year results, especially those influenced by unique, non-recurring factors, can mislead investors into undervaluing the benefits of diversification. Exhibit I illustrates that, over extended periods, diversified portfolios have historically outperformed the 60/40 portfolio, despite the latter's stellar 2024 performance. This enduring advantage of diversification stems from its ability to capture returns across a broader range of asset classes, including real assets and alternative investments that are less correlated with traditional equities and bonds. By spreading risk, diversified portfolios may be better positioned to weather economic shifts and market volatility.
Focusing on historical returns makes diversification seem unnecessary. With the benefit of perfect hindsight, it is easy to look back on results and choose the handful of assets that outperformed. The danger of an ex-post examination of returns is the temptation to extrapolate past results into the future. However, past performance is no guarantee of future results. Regrettably, we cannot predict the future with certainty, however history and financial models can be guides to the directionality of future returns.
Wilshire has been formulating long-term (10-year) returns, risk, and correlation assumptions since the early 1980s.2 We believe that high current valuations are likely to lead to lower capital market return expectations over the next 10 years versus the last 10 years. Importantly, Wilshire's capital market assumptions forecast a 10-year return expectation of 5.32% for the 60/40 portfolio as of December 31, 2024. For many investors, this level of return will be unsatisfactory. Fortunately, a broader opportunity set of asset classes offers both more attractive returns and diversification which can improve portfolio efficiency and dampen volatility.
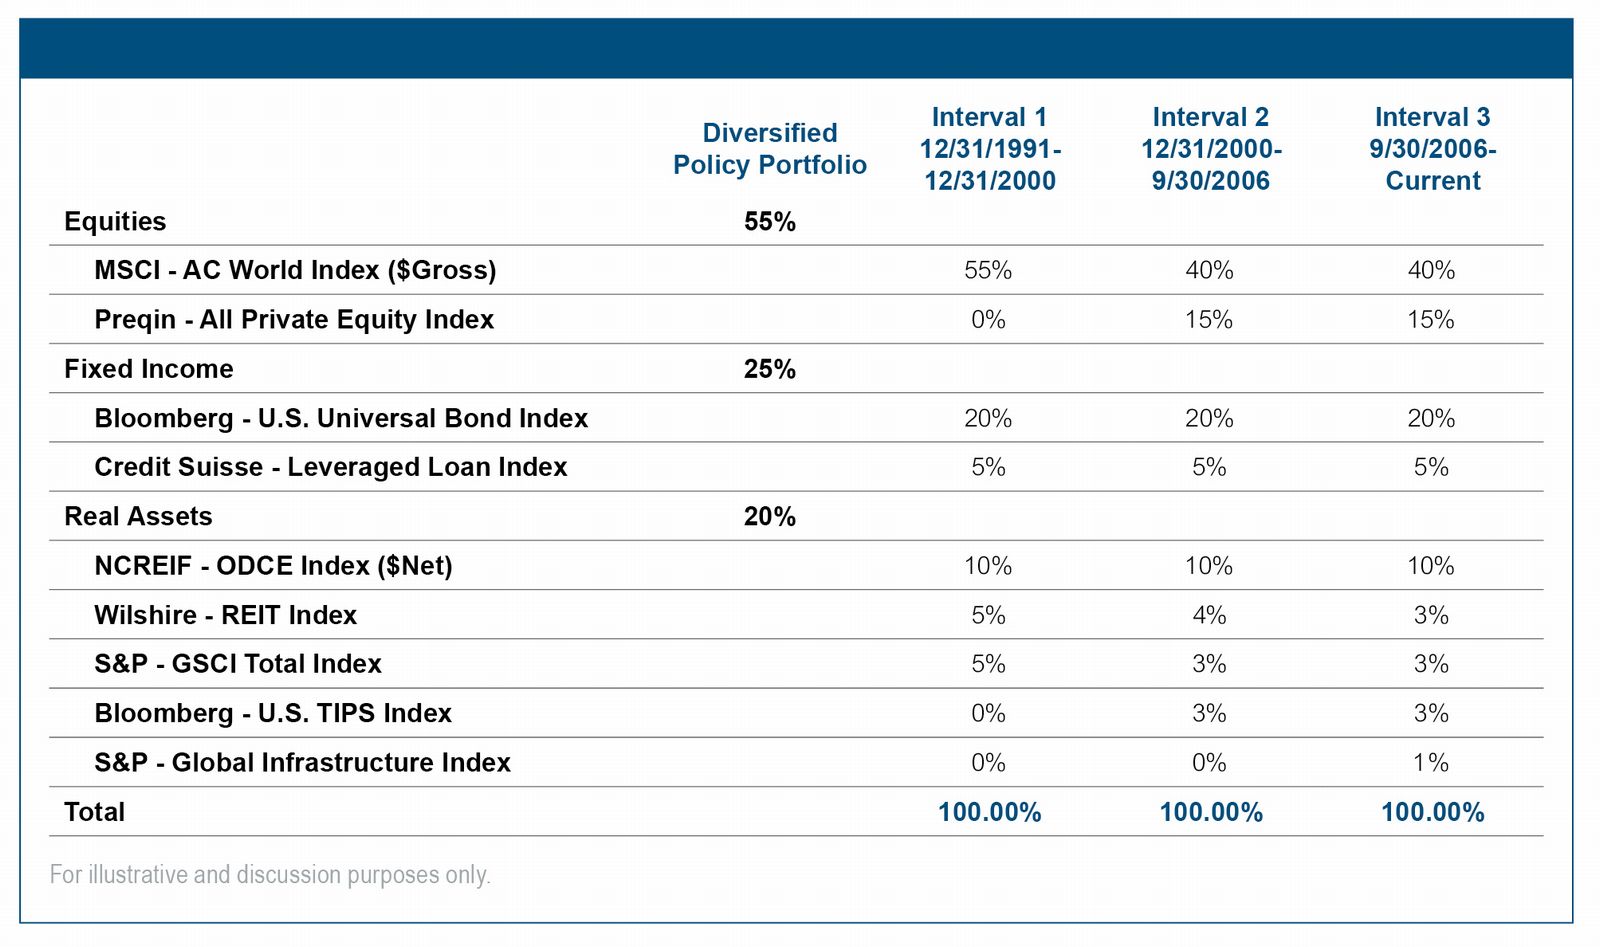
For example, non-U.S. equities, non-core bonds, private assets, and a basket of real assets including real estate, infrastructure and commodities are projected to offer premiums to both U.S. equities and core fixed income. The table in Exhibit II details the array of asset classes that might be included in a typical diversified policy portfolio and the constraints used to generate the efficient frontiers shown in Exhibit III.
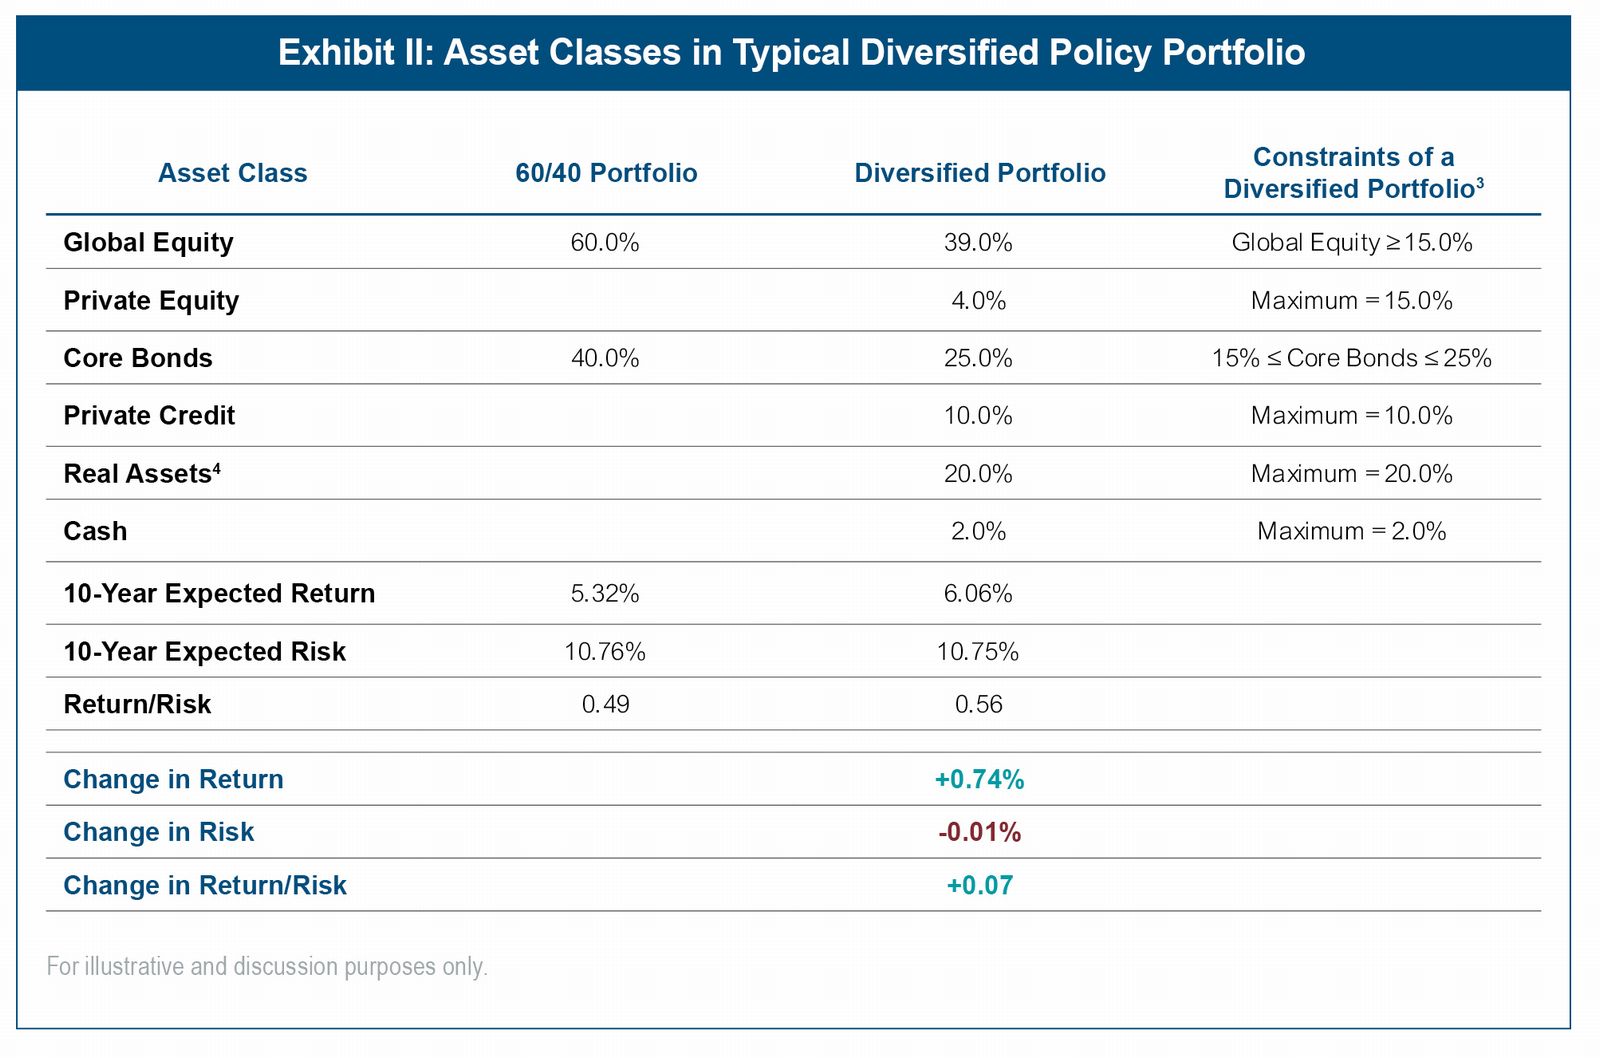
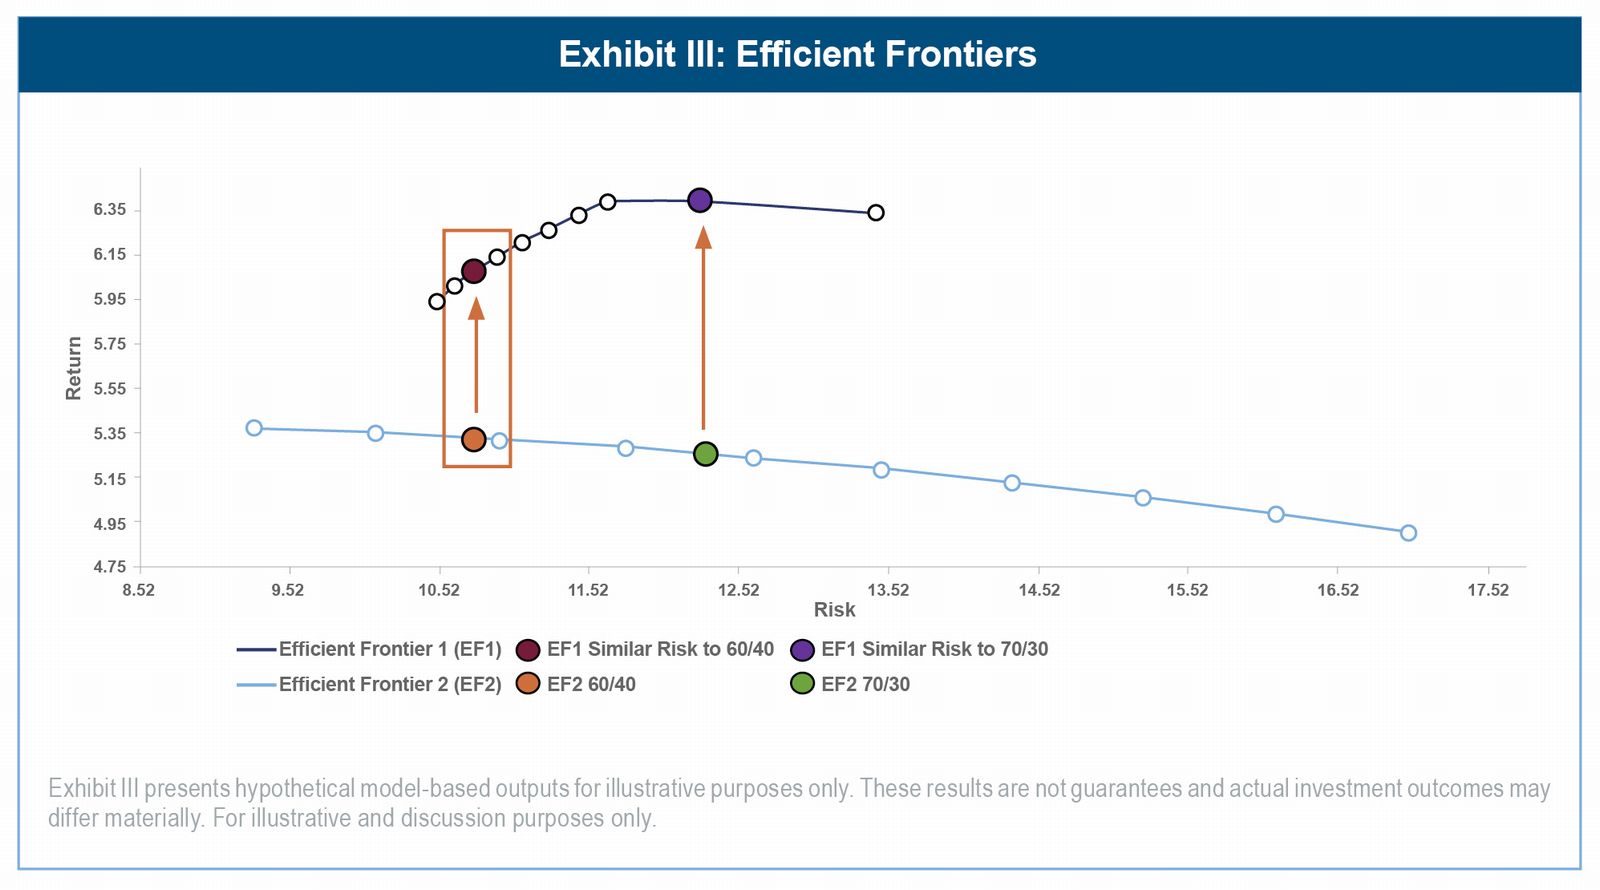
As shown in Exhibit II, a diversified policy portfolio with a similar risk level to the 60/40 portfolio increases expected returns by 74 basis points and improves portfolio efficiency by boosting return per unit of risk from 0.49 to 0.56. Moreover, we can broaden the comparison via a series of optimizations. Exhibit III presents two efficient frontiers. Efficient Frontier 1 (EF1) is an optimization of the array of asset classes shown in Exhibit II. Efficient Frontier 2 (EF2) optimizes only global equities and core bonds. From this analysis we see that at every risk level, a diversified policy portfolio (mapped on EF1) is expected to offer higher returns than the two-asset reference portfolio of similar risk (mapped on EF2). The box in Exhibit III highlights the return expectations of the 60/40 portfolio and the higher return expectations for the diversified portfolio of the same expected risk from the table in Exhibit II. As a point of comparison, we also plot a 70/30 portfolio with an even larger return premium for the diversified portfolio of the same expected risk. Importantly, these return expectations are model-based hypothetical projections derived from Wilshire's capital market assumptions. They rely on numerous assumptions regarding asset class behavior and correlations that may not materialize. Actual results may differ materially from these estimates. To the extent that active managers can add excess returns over their benchmarks, the total portfolio expected returns may be higher than shown in Exhibits II and III.
In conclusion, the 60/40 portfolio's impressive 2024 performance is a reminder of the strength of simplicity. However, investors must be cautious not to let recency bias cloud their judgment. History demonstrates that while there are periods where the 60/40 portfolio outshines, diversified portfolios have consistently delivered superior returns over the long term.
As we look to the future, the power of diversification remains a cornerstone of sound investment strategy. By spreading risk and capturing opportunities across a broad spectrum of asset classes, diversified portfolios offer a durable framework for navigating the uncertainties of the market. For investors seeking to achieve sustainable, long-term growth, the complexity of diversification is not a hurdle, it is an advantage.
Disclosures: Wilshire Advisors LLC (“Wilshire”) is an SEC-registered investment adviser serving diverse institutional and intermediary clients. Wilshire's products, services, and advice may differ among clients and may not be available to all investors. Information presented is for informational purposes only, does not constitute legal, tax, accounting, or investment advice, and is subject to change. Certain data has been obtained from third-party sources believed reliable, but accuracy is not guaranteed. Charts, forecasts, and projections are for illustrative purposes only and do not reflect actual or expected performance. Past performance is not indicative of future results. This material may include forward-looking statements which reflect Wilshire's current views, involve risks and uncertainties, and may change without notice. Reliance on such statements should be limited. For additional information, please review Wilshire's ADV Part 2 at www.wilshire.com/ADV.
Wilshire® is a registered service mark.
Copyright © 2025 Wilshire. All rights reserved.
M756749 E0726
Endnotes:
1 Credit Suisse Leveraged Loan Index for period 12/31/1991 – 11/30/2024, S&P UBS Leveraged Loan Index for period 12/1/2024 – 12/31/2024.
Bio: Joanna Bewick, CFA, Managing Director is instrumental in both investment and operational capacities for Wilshire's discretionary clients. As a member of the Wilshire Investment Committee, Ms. Bewick plays a pivotal role in shaping the firm's investment strategy. She also serves as a senior consultant to public, corporate, and non-profit institutions, while leading the Wilshire Diverse-Owned Managers Committee.
Christopher Tessman is a Senior Vice President at Wilshire, specializing in client service for public pension plans and overseeing Wilshire Compass. Since joining Wilshire in 2000, Mr. Tessman has played a key role in advising a diverse array of asset owners, including public and corporate pension plans, foundations, endowments, insurance companies, family offices, and other wealth managers.