How Your Public DB Plan Compares at Year-End 2025
By: Brad Penter, Callan
This article provides public Defined Benefit (DB) plan fiduciaries with the data to benchmark their plans compared to peer plans, over time and by size.

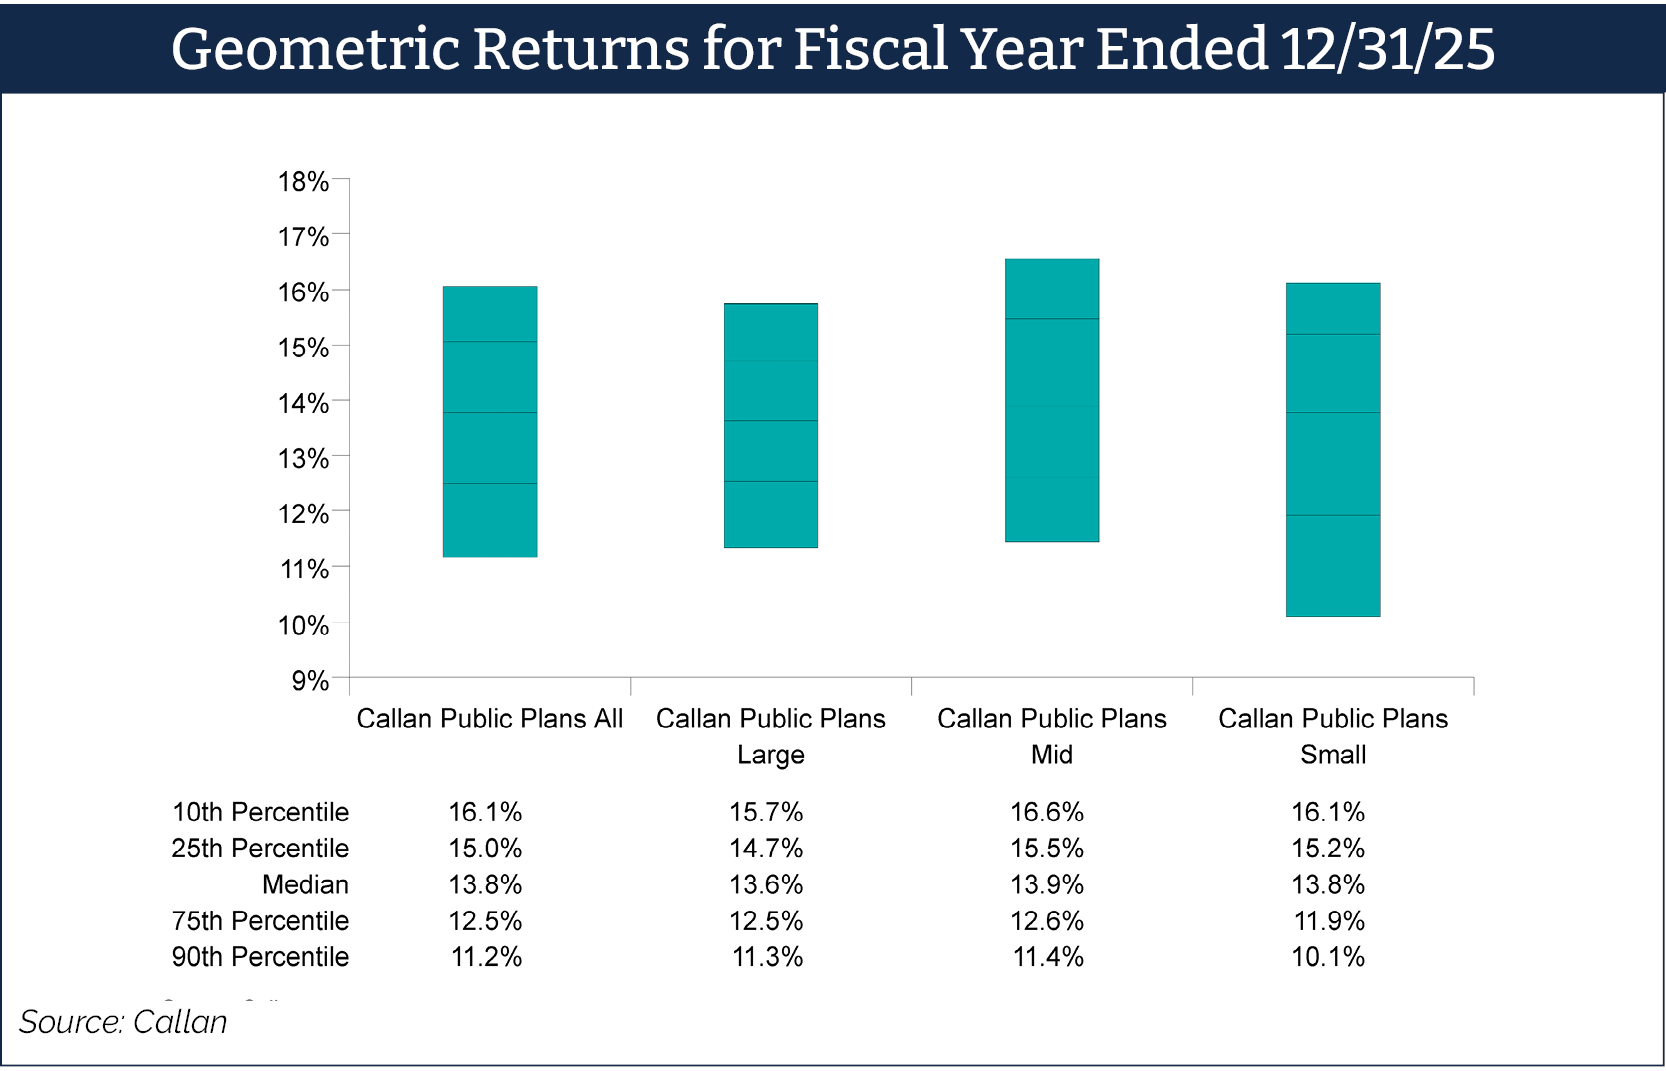
December 31 is a common fiscal year end for roughly a quarter of public defined benefit (DB) plans, making the end of the calendar year performance data an important measurement period. In the fiscal year ended Dec. 31, 2025, the median public DB plan gained 13.8%, nearly double the median assumed rate of return of 7.0%.
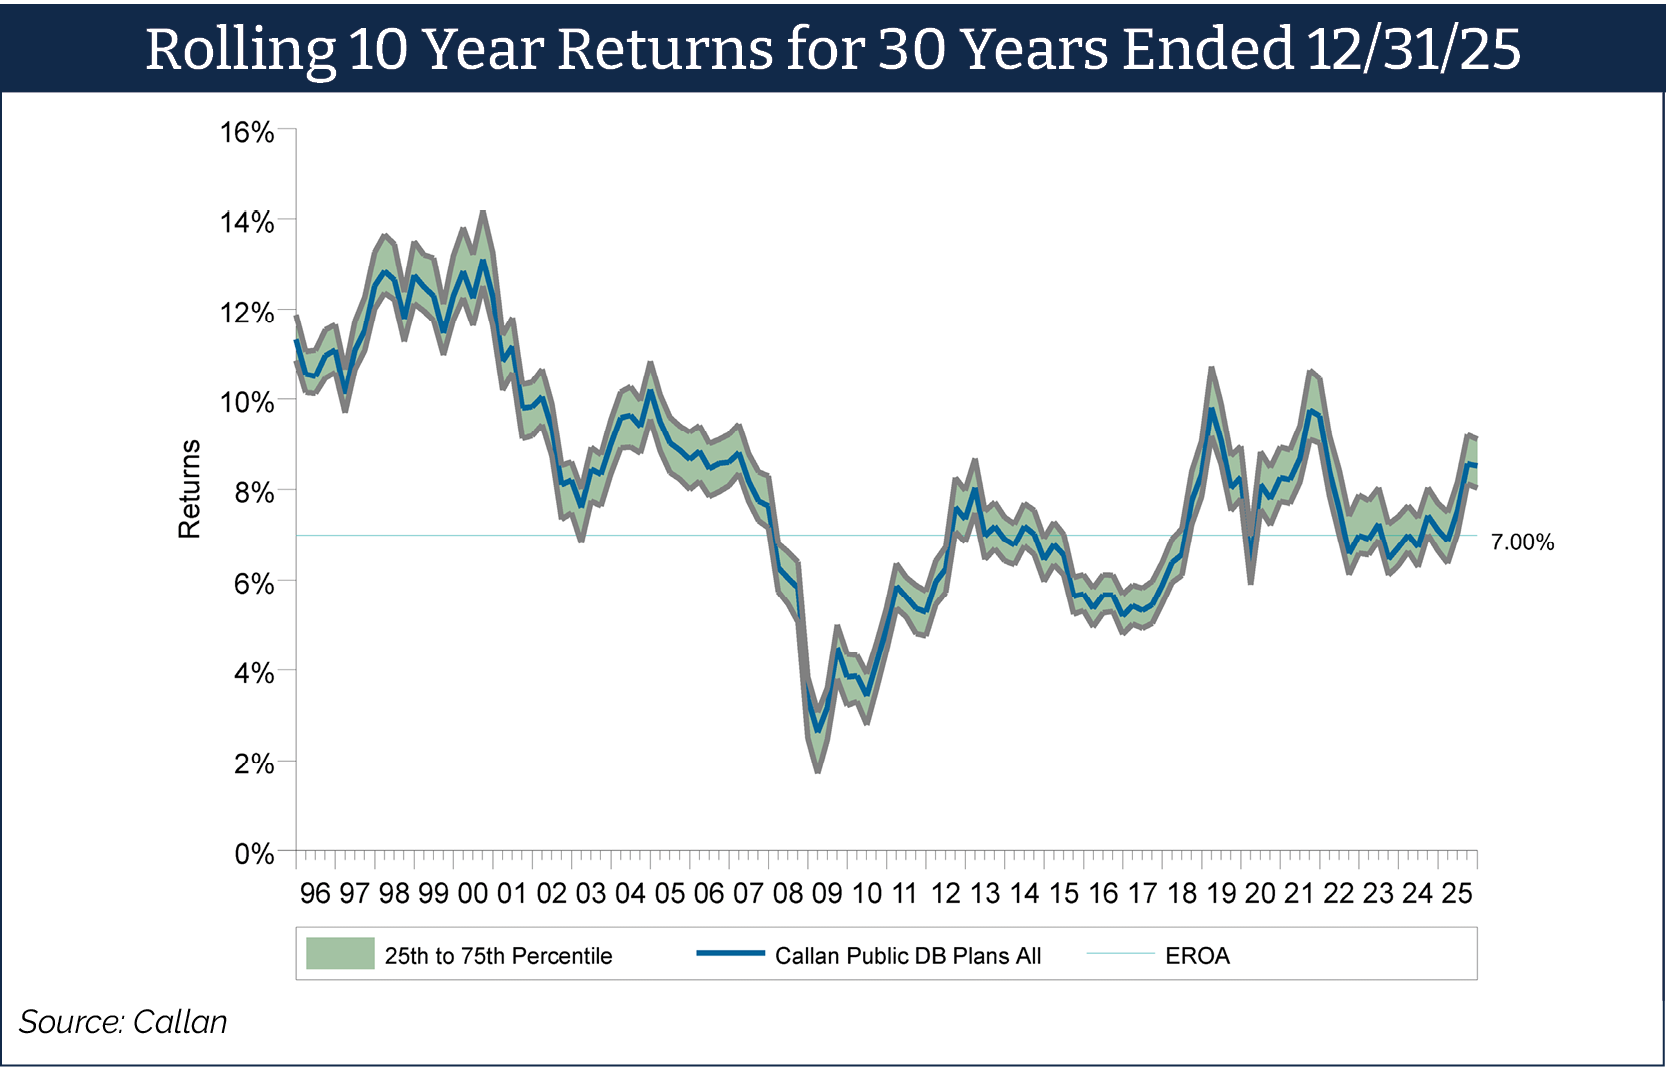
This marks the third consecutive calendar year in which the median public plan’s return was well in excess of the median assumed rate of return (2023: 12.8%, 2024: 10.0%). This bodes well for an improvement in funded status across public pension plans. Many use an actuarial smoothing period of five years. Over the last five years, the median public DB plan has an annualized gain of 7.2%.
Drivers of Public DB Plan Returns
All major asset classes ended the calendar year with gains, led by global ex-U.S. equities (MSCI ACWI ex-USA: 32.3%), U.S. equities (Russell 3000 Index: 17.2%), and core fixed income (Bloomberg Aggregate Index: 7.3%).
In alternatives, hedge funds had the strongest year (HFRI Fund Weighted: 12.4%), followed by private equity (Cambridge Private Equity: 9.5%), private credit (Cambridge Senior Debt: 7.8%), and real estate (NCREIF ODCE: 2.9%). Gold investors, while a relatively uncommon allocation in public pensions, were rewarded spectacularly with an annual return of 64.3%.
Dispersions in results by plan size were relatively muted for calendar year 2025. Mid-sized plans marginally outperformed their smaller and larger peers. Small and mid-sized plans’ more liquid portfolios benefited as public equities generated the strongest results, while private equity portfolios continued to lag.
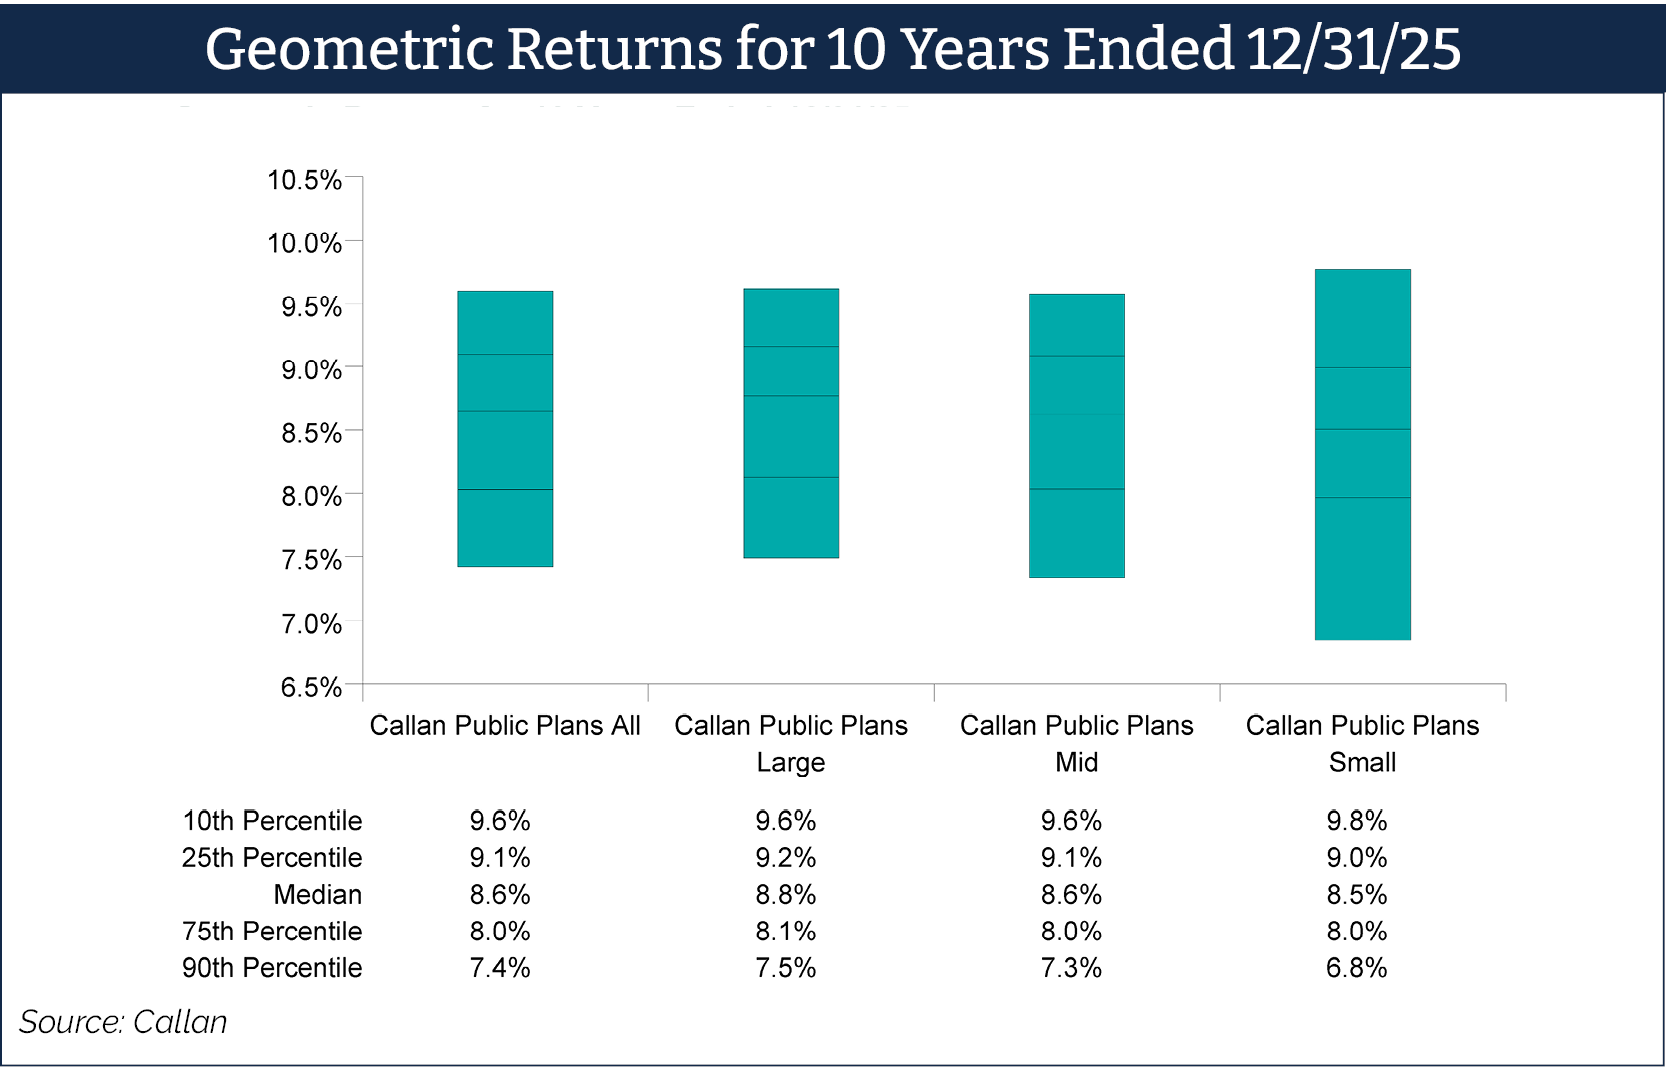
Over a 10-year timeframe, the median large plan has outperformed its smaller peers. Allocations to alternative investments have been beneficial, most particularly when comparing plain vanilla fixed income (Bloomberg Aggregate: 2.0%) versus more complex diversifiers (Cambridge Senior Debt: 8.0%, NCREIF ODCE: 4.2%) where bigger plans have higher allocations. On average, large public plans allocate ~25% of their portfolio to alternative investments versus 15% for mid-sized plans and ~10% for small plans.
As always, Callan recommends public plans should focus on their ability to achieve their long-term expected return on assets (EROA) target rather than fixating on short-term volatility. The long-term approach has worked out over time as the median public plan’s 10-year return has consistently exceeded the median return hurdle (7.0%).
About the author:
Brad Penter, CFA, CAIA, is a vice president in Callan’s Atlanta consulting office. His responsibilities include supporting clients and consultants in the areas of performance evaluation, strategic planning and implementation, investment manager review, and the coordination of special client proposals and requests. Brad is a member of Callan’s Public Defined Benefit Focus Group.