
The Hidden Risk in Portfolios: Why Today’s Market Concentration Deserves a Closer Look
By: Brett Hickey, Star Mountain Capital
Exposure to software and large-cap technology across both public and private markets is creating outsized portfolio risk, and the lower middle-market may offer a compelling solution through greater diversification and enhanced return potential.

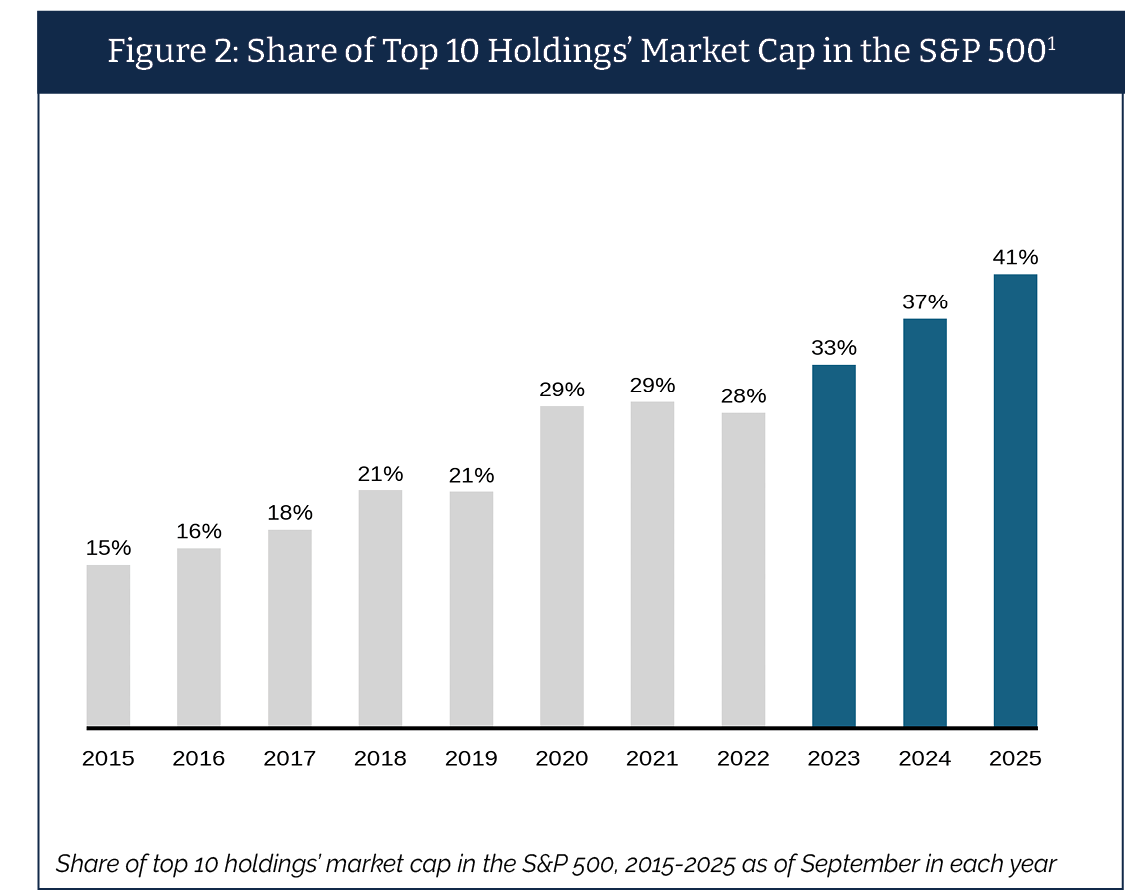
A significant portion of today’s market risk is increasingly concentrated in a narrow set of sectors, particularly within large-cap technology and software. For many investors that exposure is far larger and more interconnected than it appears. In public equities, the ten largest stocks in the S&P 500 now account for 41% of the index’s market capitalization, approximately 175% higher than a decade ago.1 At the height of the Dotcom bubble, the top ten stocks only accounted for 27% of the S&P 500 Index’s weight.2 Currently, valuations are similarly elevated, as the cyclically adjusted price to earnings ratio is 40.1, nearing the peak reached during the Dotcom boom in 1999.3
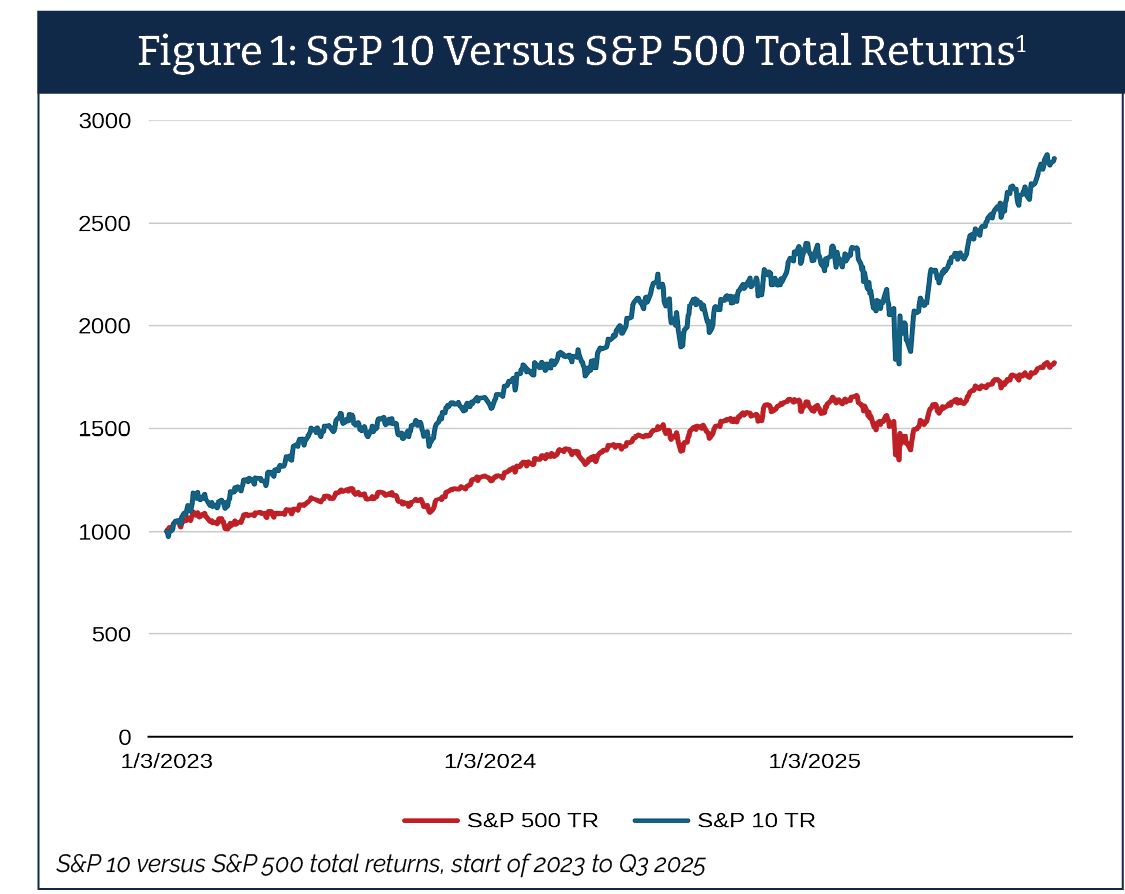
These risks extend beyond public markets. Software has accounted for roughly 40% of total private equity deal value over the past five years.4 In early February 2026, public software stocks lost over $1.2 trillion in aggregate market value over a five day trading period, as many investors reassessed the durability of subscription-based business models in light of AI driven disruption.5 That repricing is migrating into private markets: secondary buyers are reportedly demanding discounts of up to 20% on technology heavy PE portfolios, and experts are estimating that 25% to 35% of the private credit market carries AI disruption exposure.6,7 This is particularly relevant for investors as the concentration risk is not confined to public equities.
Private equity and private credit allocations, which have grown significantly in recent years, remain materially exposed to the same technology and software sectors now facing structural headwinds.8
Differentiated Opportunity within the U.S. Lower Middle-Market
For sophisticated investors seeking resilient portfolios with strong risk-adjusted returns, the U.S. lower middle-market can offer a fundamentally different risk profile.9 Comprised of approximately 200,000 businesses with $10 to $500 million in annual revenue, the lower middle-market represents 44% of U.S. GDP and generated 65% of net new jobs from 2000 to 2023.10 Over 97% of these businesses are privately held, with many being founder-owned, service-oriented businesses that investors use every day without even knowing it in sectors such as healthcare services, professional services, and non-real estate construction and engineering.11
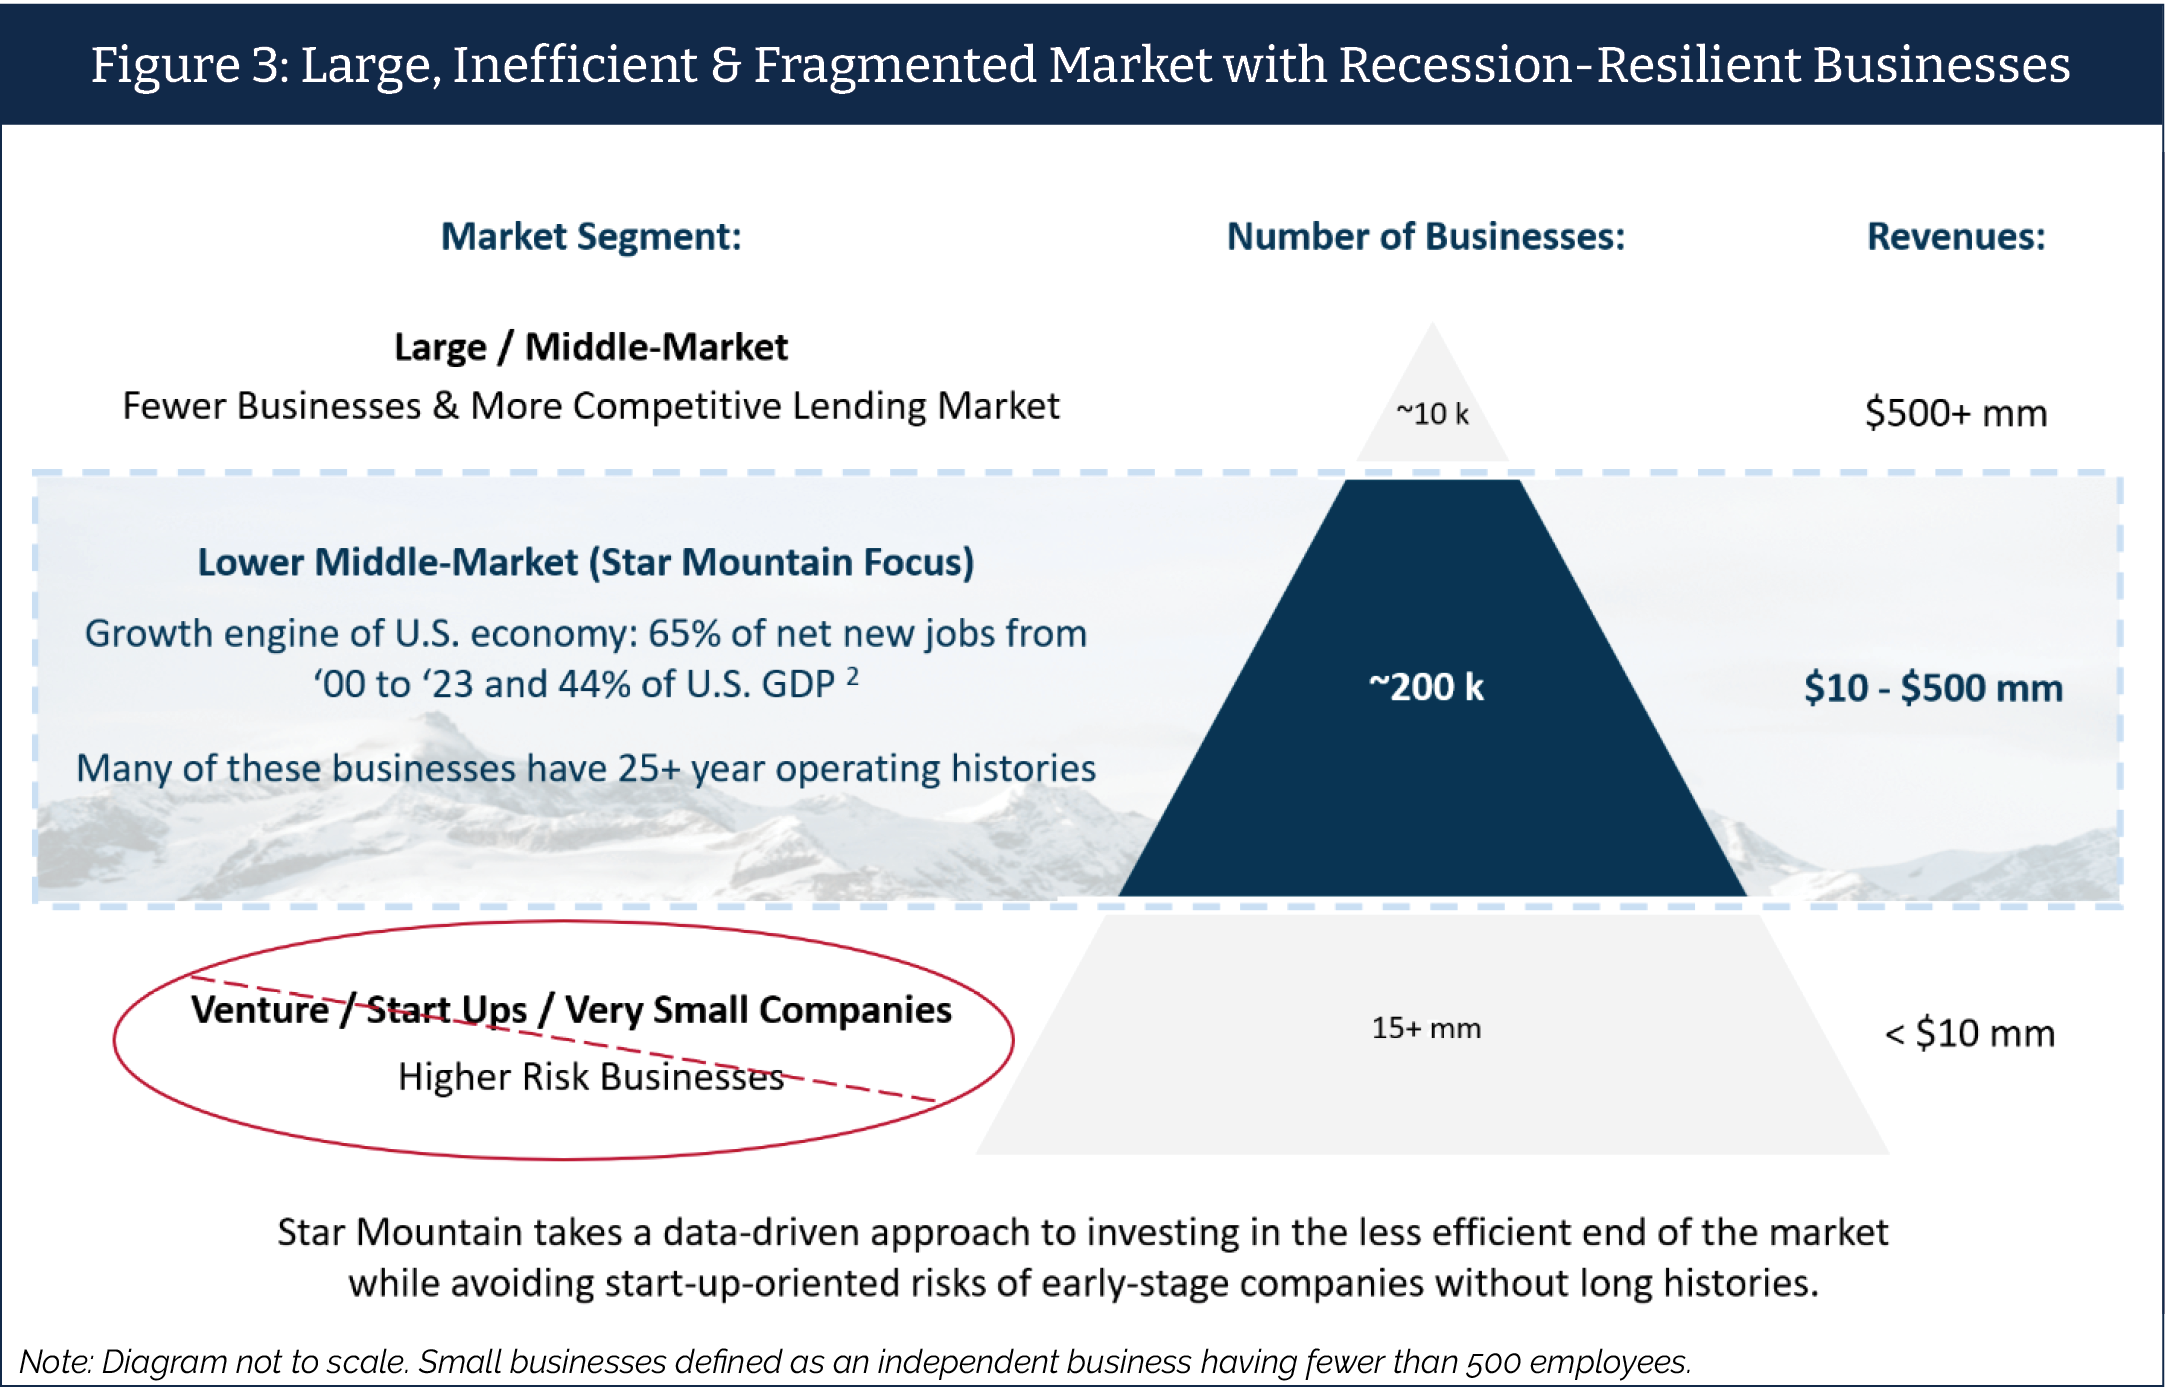
Importantly, these businesses exhibit limited exposure to the primary source of current market concentration risk: AI / software. They are often domestically focused and relationship driven, with resilient business models that tend to exhibit lower sensitivity to the repricing dynamics impacting technology exposed portfolios.
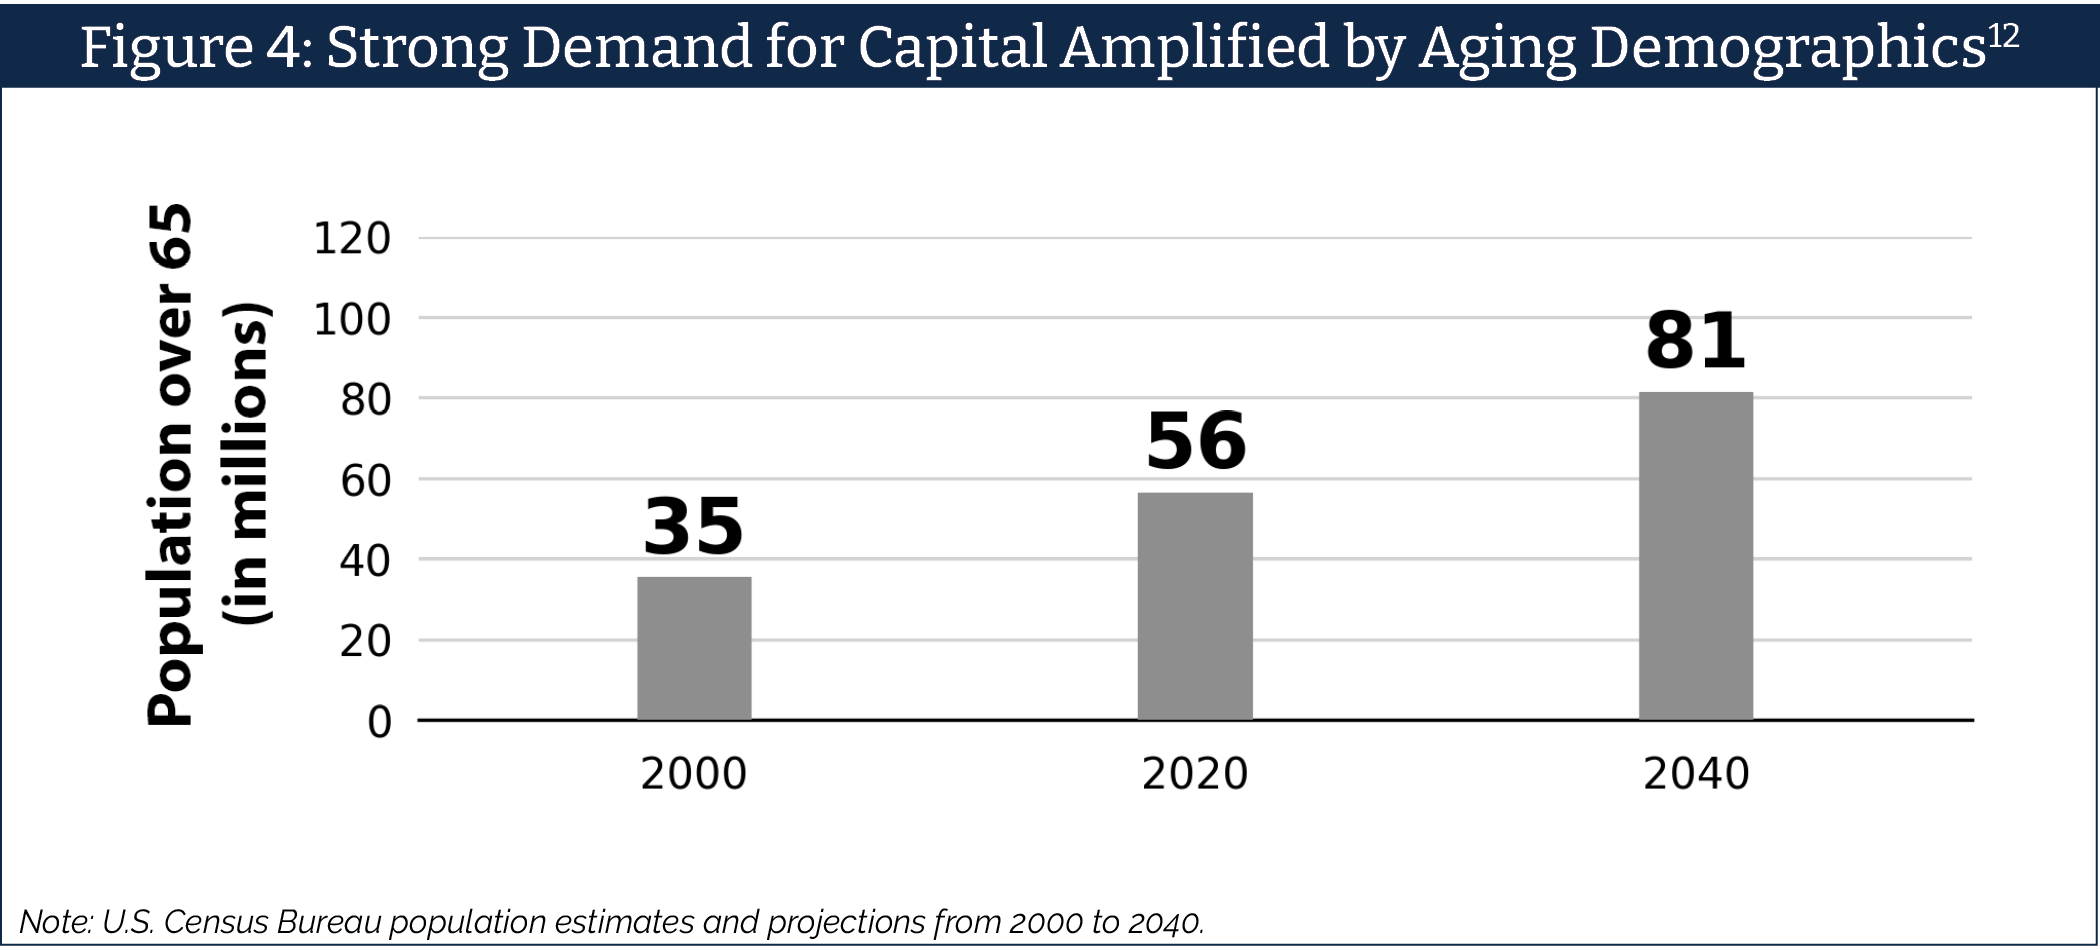
Beyond diversification benefits, structural tailwinds driving demand for capital are accelerating. An estimated 3.1 million U.S. businesses, representing 51.3% of all employer firms, are owned by individuals aged 55 or older. As Baby Boomer owners approach retirement, lower middle-market firms are expected to transition ownership, creating a substantial need for experienced lending partners.
Meanwhile, the supply of capital remains constrained. The number of U.S. commercial banks has declined approximately 50% over the past two decades, while larger private credit funds have increasingly shifted towards larger transactions. As a result, lower middle-market companies remain comparatively underserved.13
Portfolio Diversification Benefits within Lower Middle-Market Private Credit
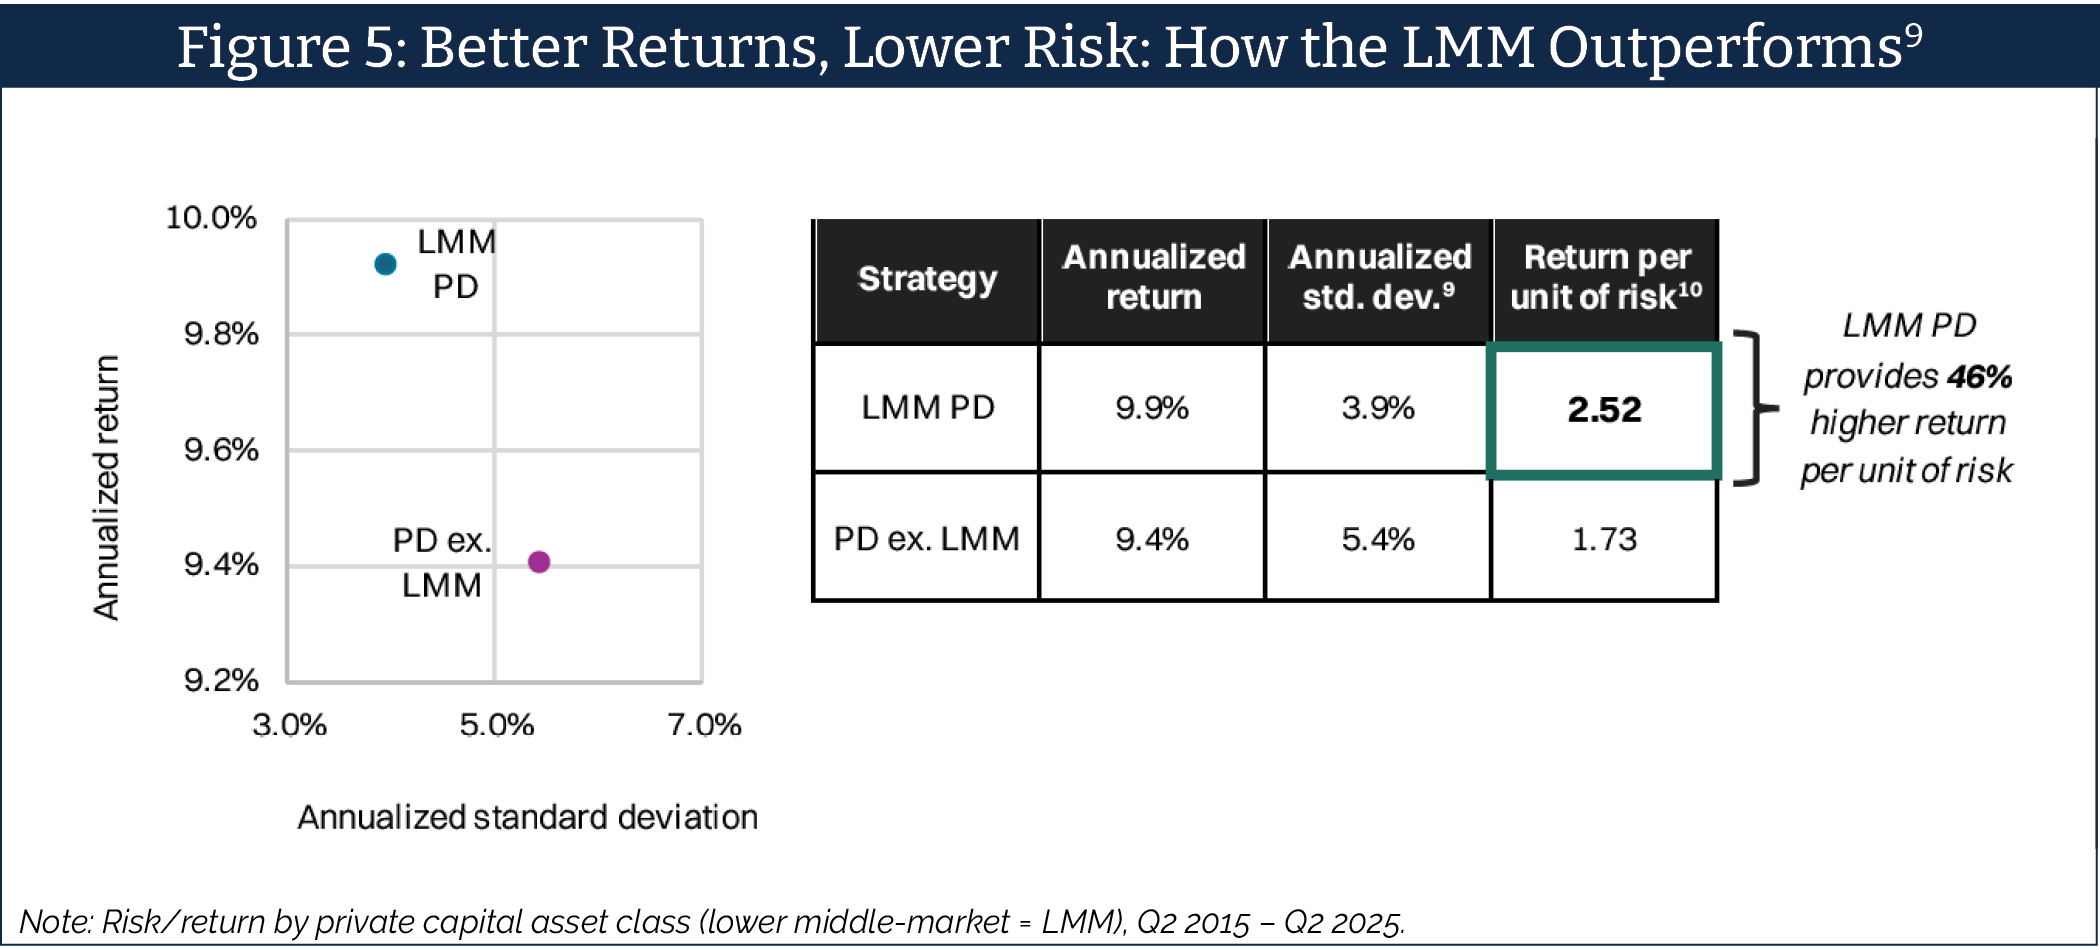
Research by top global economist and Harvard Business School Professor Josh Lerner found that lower middle-market private credit delivered a 46% higher return per unit of risk compared to private debt excluding the lower middle-market segment from Q2 2015 to Q2 2025, with an annualized return of 9.9% and annualized standard deviation of 3.9%, compared to 9.4% return and 5.4% standard deviation for broader private debt.9, 14, 15, 16 Pairwise correlations with other asset classes generally fell between 0.2 and 0.7, strongly suggesting the segment’s role as a genuine diversifier.
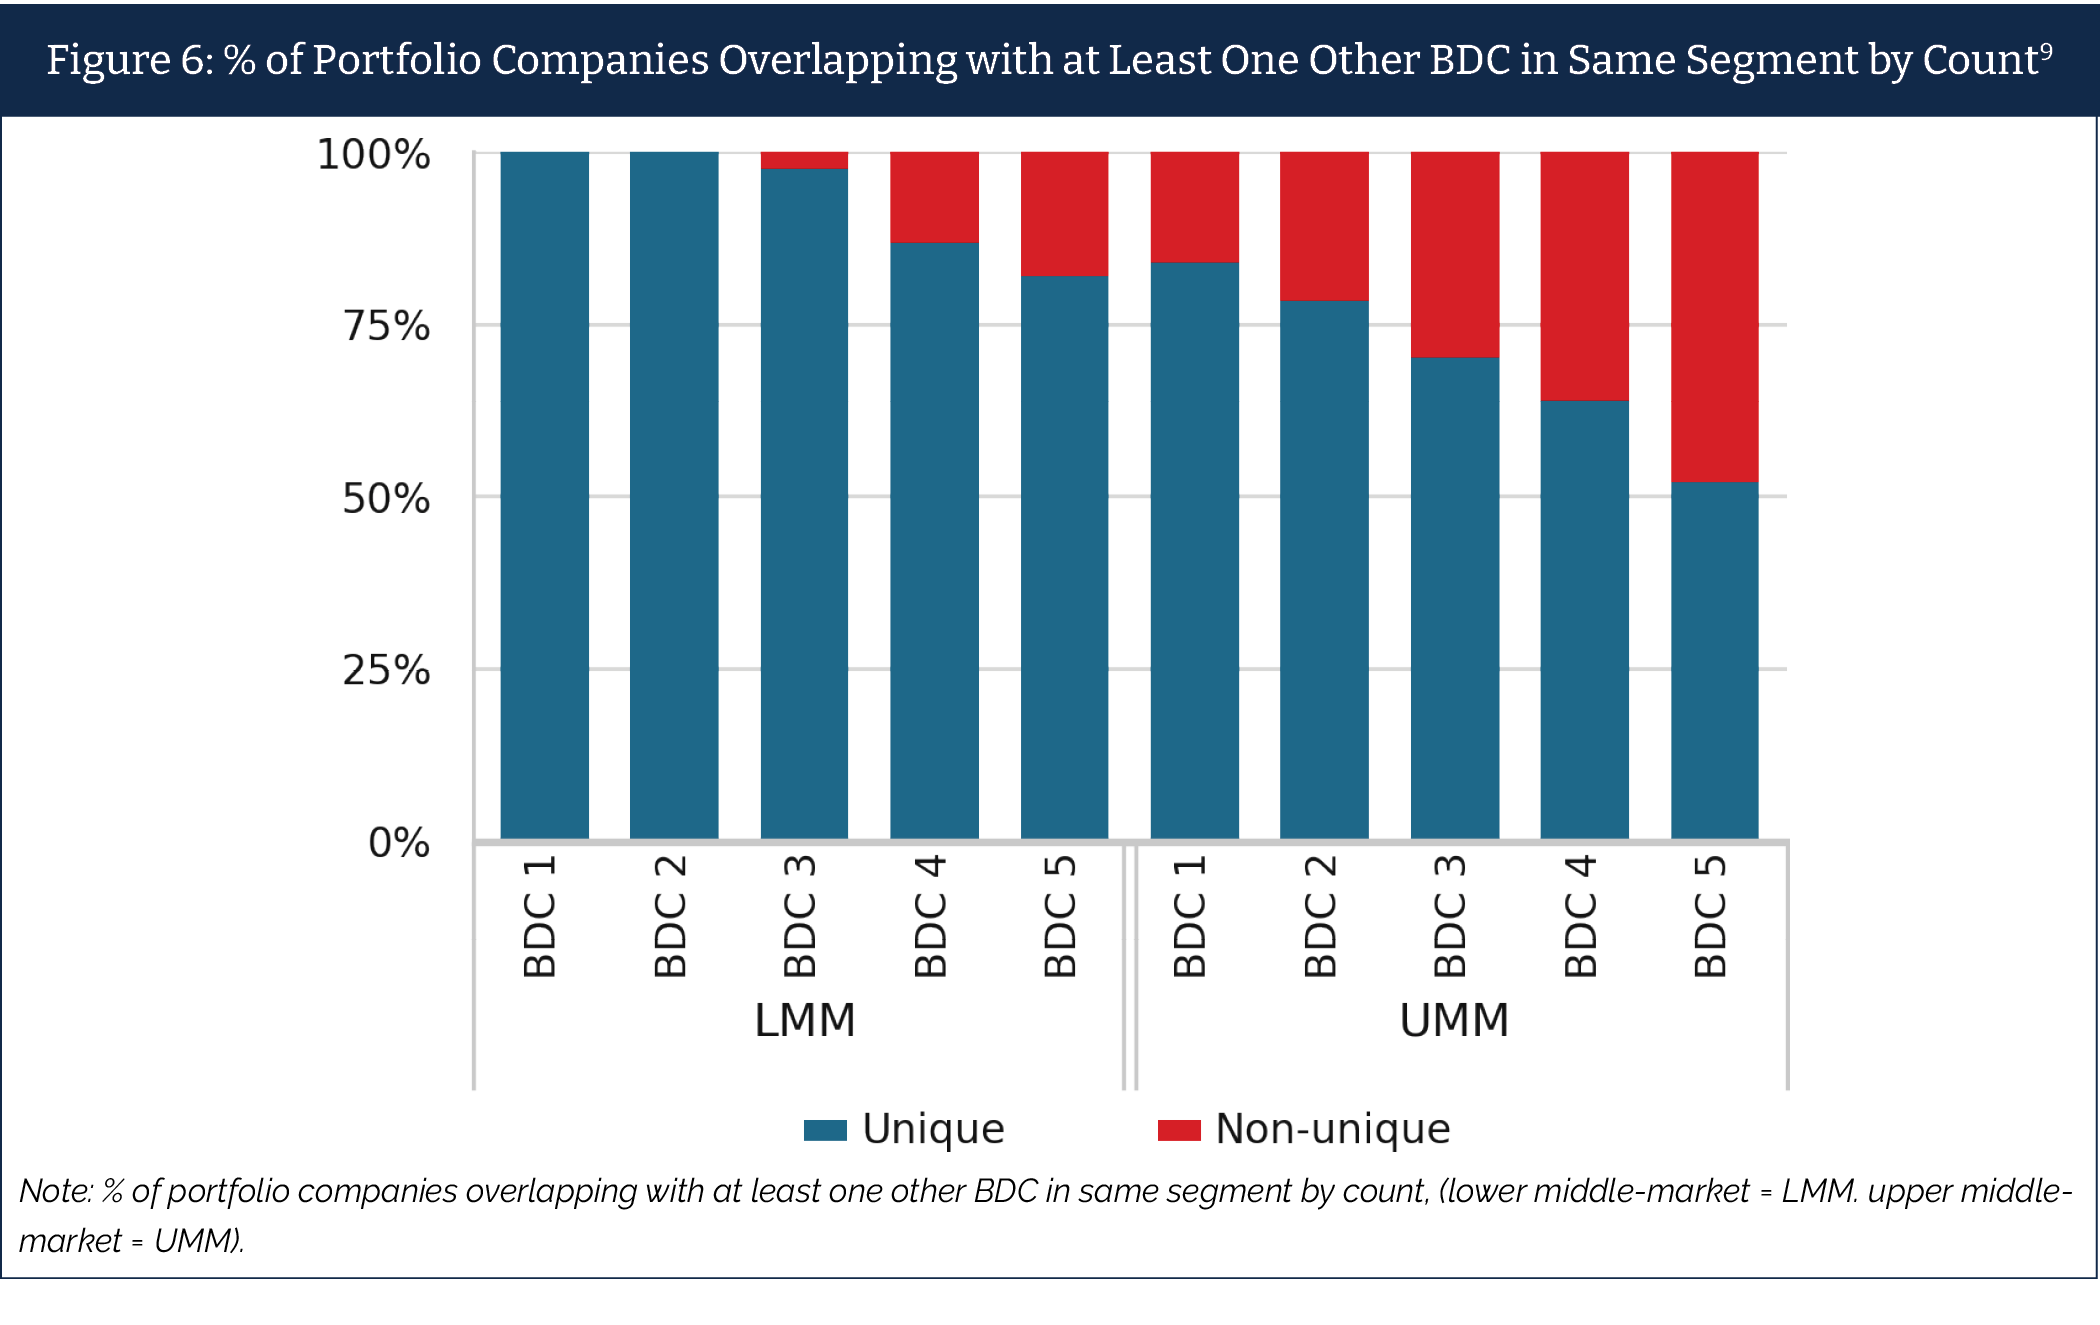
Lower middle-market lending can also offer structural protections increasingly rare in larger credit markets. Maintenance covenants are standard, and portfolio company overlap among lenders is significantly lower than in the upper middle-market, reducing the “false diversification” risk that can amplify losses during credit events.
Conclusion
In a market defined by software driven concentration and AI fueled uncertainty, investors should examine where their true exposures lie. The lower middle-market, with its breadth of service-oriented businesses, favorable supply demand dynamics, and historically attractive risk-adjusted characteristics, offers a compelling source of potential durable diversification in an increasingly narrow and volatile market environment.
About the author: Brett Hickey, Chief Executive Officer, has been structuring, analyzing and managing private equity, mezzanine and U.S. Government sponsored investment funds for over a decade. Prior to launching Star Mountain Capital, Mr. Hickey was the Co-Founder and President of a multi-manager platform including 4 U.S. state sponsored small business investment funds and helped structure over a dozen funds representing a billion dollars in assets.
Mr. Hickey formerly worked as an Investment Banker at Citigroup Global Markets in New York City where he worked on over $8 billion in capital raising and restructuring transactions and served as Senior Analyst on the $16.1 billion merger of the St. Paul Companies, Inc. and Travelers Property Casualty Corp.
Mr. Hickey earned a Bachelor of Commerce degree from McGill University and is an alumnus of Harvard Business School’s Owner / President Manager CEO training and management program.
Disclosures: This presentation is provided for informational and educational purposes only and does not constitute an offer to sell, or a solicitation of an offer to purchase, any security or investment product managed or advised by Star Mountain Fund Management, LLC (“Star Mountain”). The information herein reflects the views and market observations of Star Mountain as of the date of publication and is subject to change without notice. This content is not intended as investment, legal, accounting, or tax advice, and prospective investors should consult their own professional advisors. The information herein may include data derived from third-party sources believed to be reliable, but Star Mountain makes no representations as to its accuracy or completeness. This content may be shared publicly but should not be reproduced or redistributed without written permission from Star Mountain.
Certain Risks of Investment
Investments in private funds, including LMM private credit funds, involve significant risks, including the risk of loss of capital. These investments are illiquid, speculative, and not subject to the same regulatory requirements as mutual funds or other registered investment products. There is no assurance that investment objectives will be achieved, and past performance is not indicative of future results. Statements regarding default rates, recovery rates, or structural protections in the LMM credit space are based on historical data and should not be interpreted as guarantees. Any investment should be made only after a careful review of the relevant offering documents and consultation with independent advisors.
Endnotes:
1. S&P Global and MacroMicro, as of October 2025.
2. “Comparing the dot-com bubble with today’s market,” Investing.com, August 2024.
3. “Shiller PE Ratio by Month,” Multpl, October 2025.
4. “Private Equity’s DoomsdAI Moment,” Financial Times, Feb. 12, 2026.
5. Allianz Research, February 2026.
6. Bloomberg, “Private Equity Faces Rising Scrutiny as AI Threatens Software Valuations,” February 25, 2026.
7. CNBC, “Private Credit Stocks Plummet on Concern About Exposure to Software Industry Disrupted by AI,” February 3, 2026. UBS analysts estimate 25% to 35% of the private credit market is exposed to AI disruption risk.
8. Software Stress & AI Risk in Private Credit, Prime Buchholz, February 2026.
9. Bella Private Markets Insights, in collaboration with Star Mountain, “Hidden in Plain Sight: The Lower Middle-Market Advantage” written by Harvard Business School Professor Josh Lerner, January 2026.
10. NAICS, as of December 2024. U.S. Small Business Administration, Office of Advocacy, July 2024.
11. CapIQ, as of November 2025. Over 97% of companies with revenues between $10M and $500M are private.
12. U.S. Census Bureau, population estimates and projections from 2000 to 2040.
13. Federal Deposit Insurance Corporation (FDIC) data on FDIC-insured commercial banks in the United States.
14. Professor Lerner is a compensated Senior Advisor of Star Mountain Capital and was engaged by Star Mountain Capital to prepare the market analysis referenced in this post. Past performance and economic data are not indicative of future results.
15. Recognized by ScholarGPS and research.com.
16. Bella Private Markets Insights, produced in collaboration with Star Mountain, “Hidden in Plain Sight: The Lower Middle-Market Advantage” written by Harvard Business School Professor Josh Lerner, January 2026. Based on Preqin and PitchBook fund-level data from Q2 2015 to Q2 2025, these returns are gross of fees. The analysis uses an average management fee rate of 1.40% in its fund size calculations.