
The Map Is Not the Market: A Region on Equal Footing With the Southeast
By: Devin Combs and Casey Kahler, Graceada Partners
Many of the economic characteristics that made the Southeast a recognizable growth story for large investors are visible across the Inland West, but they have not been organized into the same coherent investment geography. If mental models influence where investors direct their attention, markets that sit outside established frameworks may be easier to overlook. That does not prove these markets are mispriced, but where attention and fundamentals diverge is a logical place to look for opportunity.

Public pension plans pursuing a median return target of roughly 7% have to separate signal from noise, and mental models help by simplifying complex information into something usable. That efficiency is also the risk. At some point, a model can harden into a shortcut that replaces analysis.
Consider an application to geography. Real estate investors hear “Southeast” and reach for a familiar framework: affordability attracts households and employers, employment and income growth reinforce migration, and population and household formation create durable real estate demand. Charlotte, Raleigh, Greenville and Atlanta are distinct markets, but investors read them as expressions of a regional thesis.
The Southeast has been a dominant theme long enough that the regional model functions almost like a benchmark. Markets are read against what the category is expected to deliver, and the framework itself helps direct investor attention and capital.
Investment professionals know a similar problem from portfolio analysis. Benchmark misfit occurs when the benchmark used to judge an investment differs from what actually drives its performance. The objective is to understand how something behaves rather than to rely on its assigned label.
Two Economies, One State Line
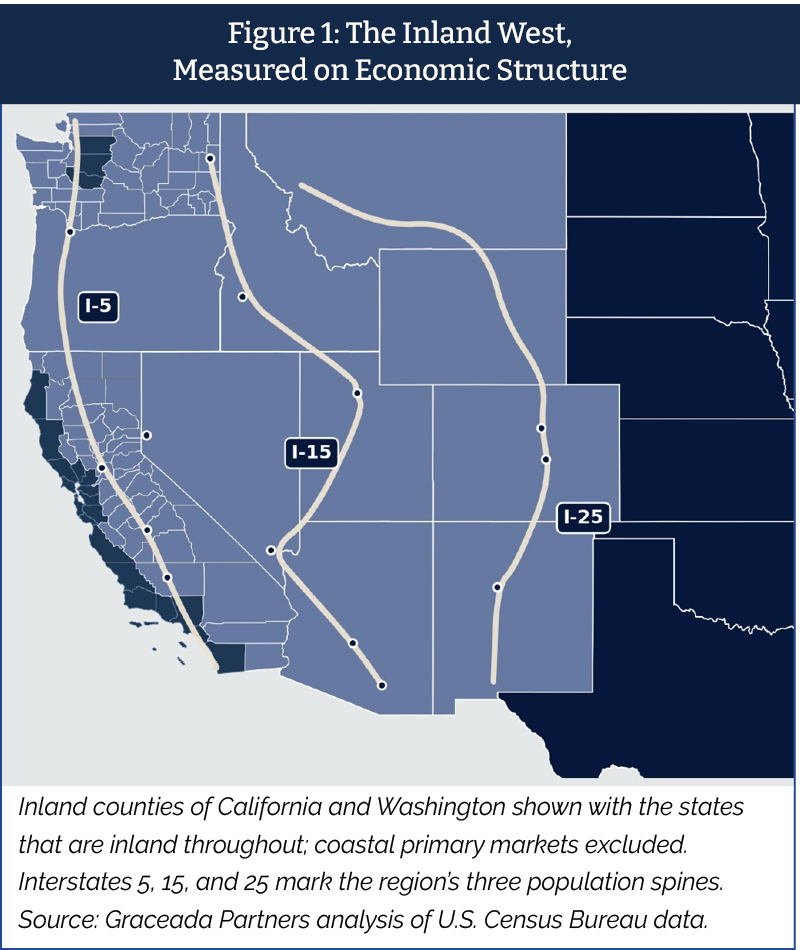
Geography creates the same problem. State boundaries tell us where one jurisdiction ends, not where one economic system ends. California and Washington each contain distinct regions. The coasts are older, far more expensive, more volatile through cycles, driven by technology wages and global capital. The inland counties are younger, more affordable, gaining the households the coast loses, and built on logistics, agriculture, manufacturing and services.
On many measures that drive real estate demand, Fresno, Bakersfield and Spokane look more like Boise and Phoenix than San Francisco and Seattle. In statewide data, they get lost in the noise of the coast.
One Region, Two Frames
Consider inland California. Its 13.1 million residents make it the largest single component of the Inland West. Using the same data and time period as the regional comparison, inland California grew per-capita personal income at 3.76% a year against the Southeast benchmark’s 3.77%, and employed residents at 1.17% against 1.03%. Population ran slightly behind, 1.06% against 1.10%.
For two decades, inland California has tracked the Southeast benchmark closely on these demand measures, yet investors view it through a very different lens. A Southeast market inherits an established growth narrative. Inland California inherits California, and with it a framework that may poorly describe its drivers.
Measuring It Whole
Defined by how its economy actually works, the Inland West is Arizona, Colorado, Idaho, Montana, Nevada, New Mexico, Oregon, Utah and Wyoming in full, the 39 inland counties of California, and the 36 Washington counties outside metropolitan Seattle. Where a major coastal market splits a state, the inland counties are measured individually and the coast excluded. That geography holds 47.3 million residents in 2024, more than any single state.
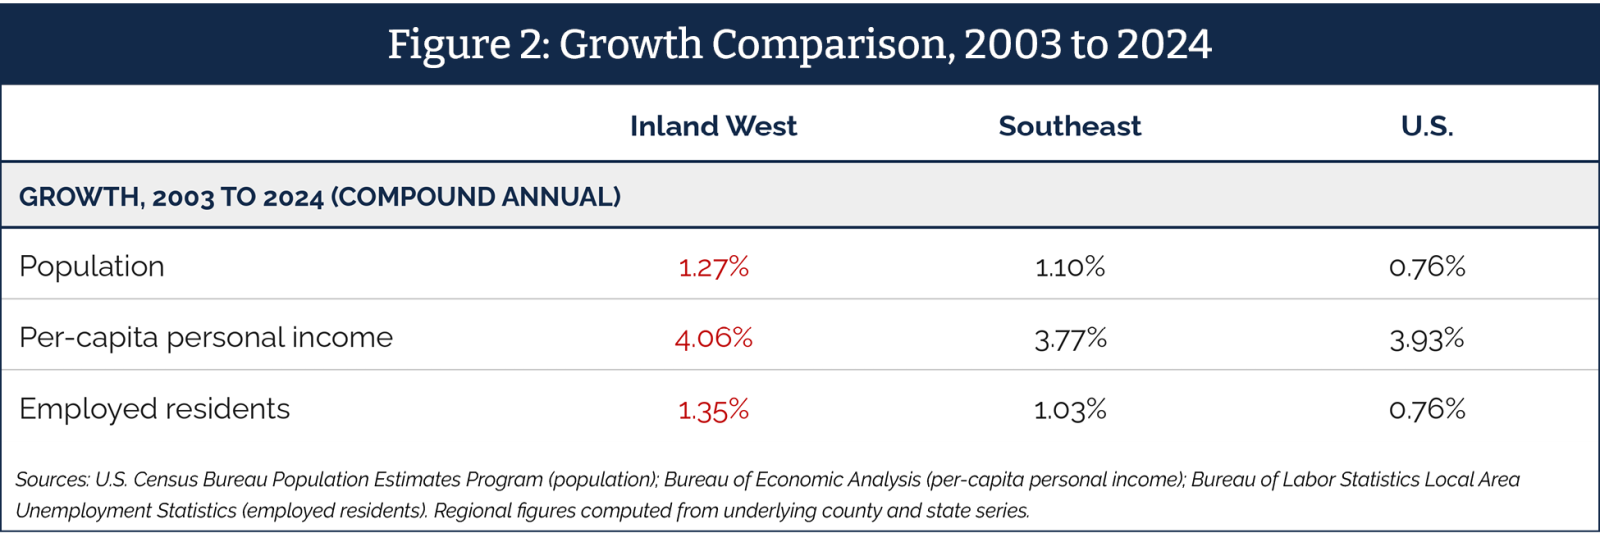
The benchmark is the high-growth Southeast that pension plans already invest in: Virginia, Tennessee, the Carolinas, Georgia and Alabama, at 49.0 million residents. Same federal sources, same 21 years, same method.
From 2003 through 2024 the Inland West grew faster on the three measures most central to long-term real estate demand: population, 1.27% a year against 1.10%; per-capita personal income, 4.06% against 3.77%; and employed residents, 1.35% against 1.03%.
Narrower definitions were also tested. Removing Oregon, inland California or inland Washington, or limiting the region to its nine full states, does not reverse those long-run relationships. In each variant the region leads by more than it does in the full definition, so including those areas makes the comparison more conservative, not less.
What This Means for a Plan
The conclusion is not that the Inland West is superior to the Southeast. Recent population momentum has favored the Southeast, and demand fundamentals alone do not determine investment returns. Supply, pricing and competition among investors matter.
The narrower finding may be more useful. Many of the economic characteristics that made the Southeast a recognizable growth story for large investors are visible across the Inland West, but they have not been organized into the same coherent investment geography.
If mental models influence where investors direct their attention, markets that sit outside established frameworks may be easier to overlook. That does not prove these markets are mispriced, but where attention and fundamentals diverge is a logical place to look for opportunity.
For a trustee reviewing a geographic allocation, that becomes a question worth putting to a consultant or manager: how was this market defined, and would the recommendation hold if the boundaries followed economic structure rather than state lines?
Or more simply: are we using the right map?
Devin Combs, CFA, is Managing Director of Acquisitions and Capital Markets at Graceada Partners, where he leads acquisitions, structures debt capital, and works with the CIO on portfolio construction. He brings twelve years of experience in real estate capital markets, primarily institutional structured finance across the Western United States, and has underwritten, structured and executed more than $5 billion in real estate transactions, working primarily in secondary and tertiary markets with a focus on multifamily and industrial. He earned his MBA from the University of Nevada, Reno, and is a CFA charterholder.
Casey Kahler is a Manager at Graceada Partners and researches and authors the firm’s market research, including Equal Footing, the study this article draws from. Casey holds a bachelor’s degree from Sonoma State University with a focus on research methods and statistical analysis.
Disclosures: Graceada Partners is registered as an investment adviser with the U.S. Securities and Exchange Commission under the U.S. Investment Advisers Act of 1940, as amended. Registration does not imply any particular level of skill or training.
This article is provided for informational and educational purposes only. It is not an offer to sell or a solicitation of an offer to buy an interest in any fund or investment product, and it may not be relied upon as legal, tax or investment advice.
The data cited is drawn from U.S. Census Bureau, Bureau of Economic Analysis, and Bureau of Labor Statistics sources believed to be reliable. Graceada Partners does not guarantee the accuracy or completeness of such information and assumes no liability for damages resulting from its use.