Industry Insights: Evolving Exposures Amid Changing Circumstances
By: Jonathan Cogan, CFA, CAIA and Sarah Siwinski, CFA, BlackRock

As the world and markets continue to dynamically evolve, so have public pensions’ asset allocations. This evolution, however, has not been uniform or linear. Our FY24 peer analysis of 145 public plans highlights significant dispersion in plan allocations and its implications for portfolio risk and return.
Qualified clients can download and review BlackRock’s Client Solutions Group U.S. Public Pension Peer Study under the Peer Studies section of this webpage.
Following the Global Financial Crisis (GFC), plans on average rotated exposures out of public fixed income and equities in favor of alternatives like private equity and real assets. But top line averages can be deceiving. Implementation, from timing, pace, extent and strategy, has delivered a wide range of investment results over the last 10 years – a trend we expect to continue over the next 10 years, based on current plan exposures and our Capital Market Assumptions. Historical returns ranged from 2.2% to 8.9% with just over 50% of plans delivering returns above their latest assumed return.1 The rotation into alternatives presents a more optimistic outlook over the next 10 years, reinforcing our expectations for just over 85% of plans analyzed to hit their targets; similarly wide return dispersion (from 5.4% - 10.3%) using a unified framework of measurement notably points to the varied investment philosophies across plans.
Of further interest, our review did not reveal a correlation between a plan’s asset allocation and its funded ratio, assumed return, maturity or spending requirements (chart 1). However, a common theme we did uncover is plans' concentration to economic growth, which drives over 80% of portfolio risk for 85% of the plans in our coverage universe. Our findings highlight that many plans intending to “diversify” their exposure across asset classes may be unintentionally increasing their absolute risk by investing in strategies with similar underlying risk properties and higher correlations. Those with larger allocations to both public and private equity, for instance, tended to fall in the highest risk cohort (chart 2).
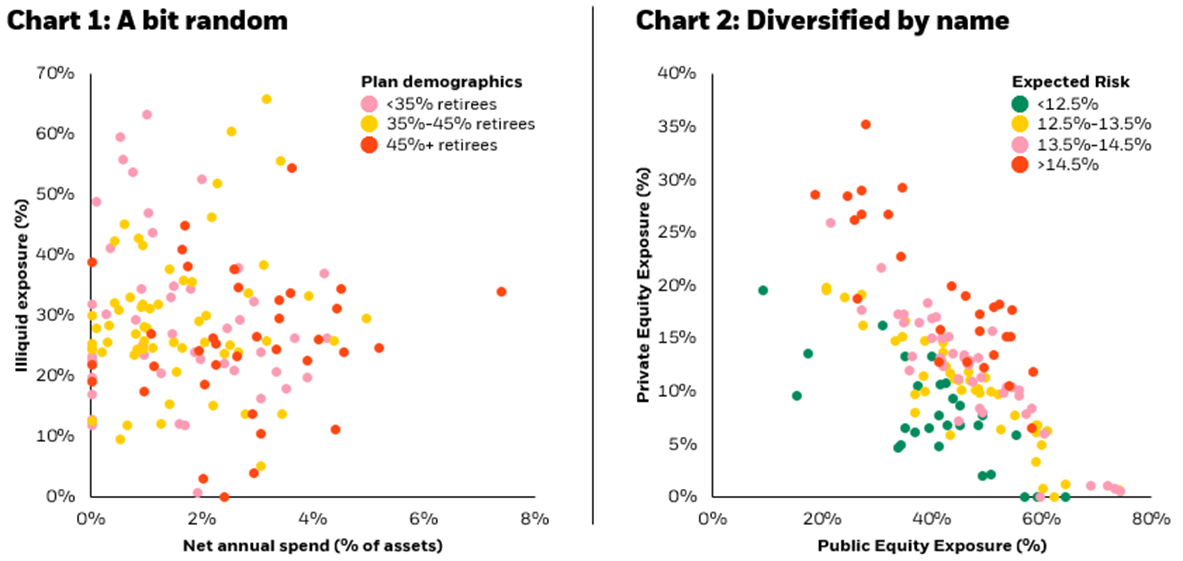
Source: BlackRock, PPD, P&I as of May 2025. Allocation metrics (average/range) and cohorting only includes plans that allocate to the asset class and may differ from metrics that include all plans. Chart 1. Net annual spend is calculated by netting contributions and benefit payments. A positive net annual spend indicates a negative net contribution/benefit payment position; plans with a positive net position are shown at 0% net annual spend. Chart 2. Risk: 84% confidence interval, 294 constant weighted monthly observations.
The average public pension reviewed allocates over 55% to public and private equity. One in three plans have over a 60% allocation and the range stretches from 25% to 75% of the total portfolio. Today's higher yield environment may provide ample opportunity for plans to reduce their equity concentration by diversifying into income-producing exposures - across both public and private markets. Furthermore, the yield differential between today and the post-GFC era underscores the potential use of income assets as more than just a risk diversifier but as a return driver as well, particularly given assumed return targets trending lower, now 6.9% on average.
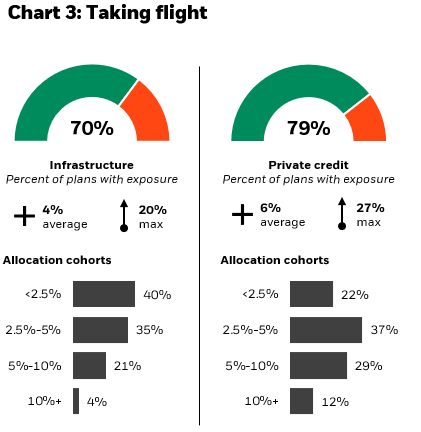
Our analysis uncovered two areas where plans have started introducing income-oriented exposures that can both diversify risk and enhance return potential: infrastructure and private credit. While the average actual allocation (which tends to be below target exposures) to infrastructure (4%) and private credit (6%) among those that allocate to these asset classes appears underwhelming on the surface, the growing popularity of these strategies and the depth of those that allocate establish a trend we expect to continue as plans evolve their journey both into and within alternatives. Across our coverage universe, 70% of plans currently allocate to infrastructure while 79% allocate to private credit; furthermore, a quarter of plans allocating to infrastructure and over 40% of plans allocating to private credit have invested over 5% of their portfolio to the respective asset class (chart 3).
To quantify the potential risk and return impact of allocating to these exposures, we ran two reallocation scenarios, rotating 5% from public equity into each asset class. The private credit reallocation projected 36bps lower risk and a 14bps higher return, while the infrastructure reallocation projected 6bps lower risk and a 43bps higher return. In addition to absolute risk reduction, expected economic growth concentration was slightly reduced in both reallocation scenarios (chart 4).
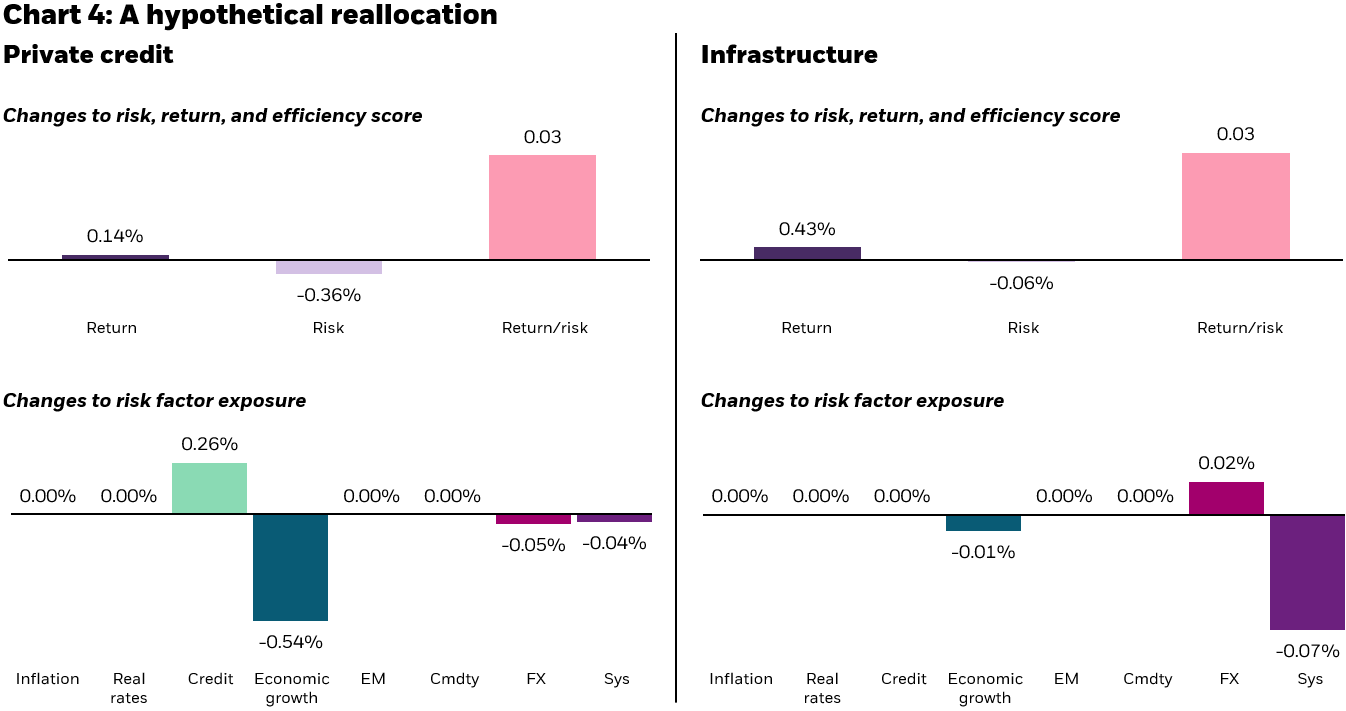
Source: BlackRock as of March 2025, based on BlackRock’s Capital Market Assumptions, Reallocation Risk Assumptions, and Aladdin portfolio risk model. Hypothetical expected returns and risk are for illustrative purposes only not guarantees of future results. The hypothetical returns shown are net of all fees and expenses and include the deduction of an advisory level model fee of 0.20%. They include reinvestment of dividends, capital gains, and interest.
The focus on liquidity remains at the forefront of many of our discussions with plans across the country - both with those under-allocated to illiquid assets looking to scale up their programs and those trimming exposure amid softer private equity distributions and rising benefit payments. Approximately 90% of plans analyzed have negative net cash flow (defined as contributions minus benefit payments) with an average net benefit payment of just over 2%. The introduction of infrastructure's contractual inflation-protected cash flows and private credit's historically reliable income distribution can potentially help offset these liquidity challenges, diversify economic growth concentration and still preserve a plan's ability to meet its assumed return target.
Many NCPERS plans are included in our coverage universe and we welcome the opportunity to review a customized peer analysis with you personally.
About the authors: Jonathan Cogan, CFA, CAIA and Sarah Siwinski, CFA lead BlackRock’s Client Solutions Group’s public pension practice. They partner with plans to address their unique investment challenges through the creation of tailored investment solutions. Jonathan and Sarah also publish industry thought leadership, like the annual peer risk analysis - now in its seventh vintage. They engage with pension staff on investment strategy and help educate boards on industry trends and themes.
General disclosure: This material is intended for information purposes only, and does not constitute investment advice, a recommendation or an offer or solicitation to purchase or sell any securities to any person in any jurisdiction in which an offer, solicitation, purchase or sale would be unlawful under the securities laws of such jurisdiction. This material may contain estimates and forward-looking statements, which may include forecasts and do not represent a guarantee of future performance. This information is not intended to be complete or exhaustive. No representations or warranties, either express or implied, are made regarding the accuracy or completeness of the information contained herein. The opinions expressed are subject to change without notice. BlackRock does not verify the information reported by each plan or data provider. Reliance upon information in this material is at the sole discretion of the reader. Investing involves risks, including possible loss of principal.
For more information, please see appendix of the 2024 US Public Pension Peer Study at: Client Solutions Group | BlackRock Institutional Insights
Endnotes
1 Unless otherwise noted, source for data is BlackRock’s US Public Pension Peer Risk Study, as of May 2025. Assumed risk target is based on latest public pension annual reports.
2 There is no guarantee that the hypothetical results will be achieved, and actual returns may be significantly higher or lower than results shown. The hypothetical returns and risk results are based on criteria applied retroactively with the benefit of hindsight and knowledge of factors that may have positively affected performance and cannot account for risk factors that may affect actual portfolio performance. In interpreting hypothetical results, one should take into consideration any inherent limitations and risks of the models used. An inherent limitation is that the allocations reflected in the performance were not made under actual market conditions and, therefore, cannot completely account for the impact of financial risk in the actual portfolio. Expected risk is defined as annual expected volatility. Risk: 84% confidence interval, 294 constant weighted monthly observations; 1yr horizon.