The Cost of Indexing
By: Dimensional Fund Advisors
Rarely do we prioritize the lowest cost when consuming goods and services, yet the investment industry often does. This is evident in the rise of index funds, which typically carry the lowest expense ratios in their categories — but like consumer goods, they may impose costs that aren’t apparent from the sticker price alone.
 This is an excerpt from NCPERS Fall 2025 issue of PERSist.
Rarely do we prioritize the lowest cost when consuming goods and services. For example, most people would not seek out the cheapest options when it comes to shoes, hotels, or sushi. That’s because we evaluate the total cost of our choices, including tradeoffs not captured by the price: prematurely worn soles, sore backs from outdated mattresses, and, well, I’ll leave the cheap sushi consequences to the imagination.
The investment industry, on the other hand, often does prioritize the lowest price. This is evident in the rise in popularity of index funds, which tend to sport the lowest expense ratios within their categories. But just like the consumer goods, index funds may be imposing costs that aren’t apparent from the sticker price. These stem from inflexibility in both construction and implementation.
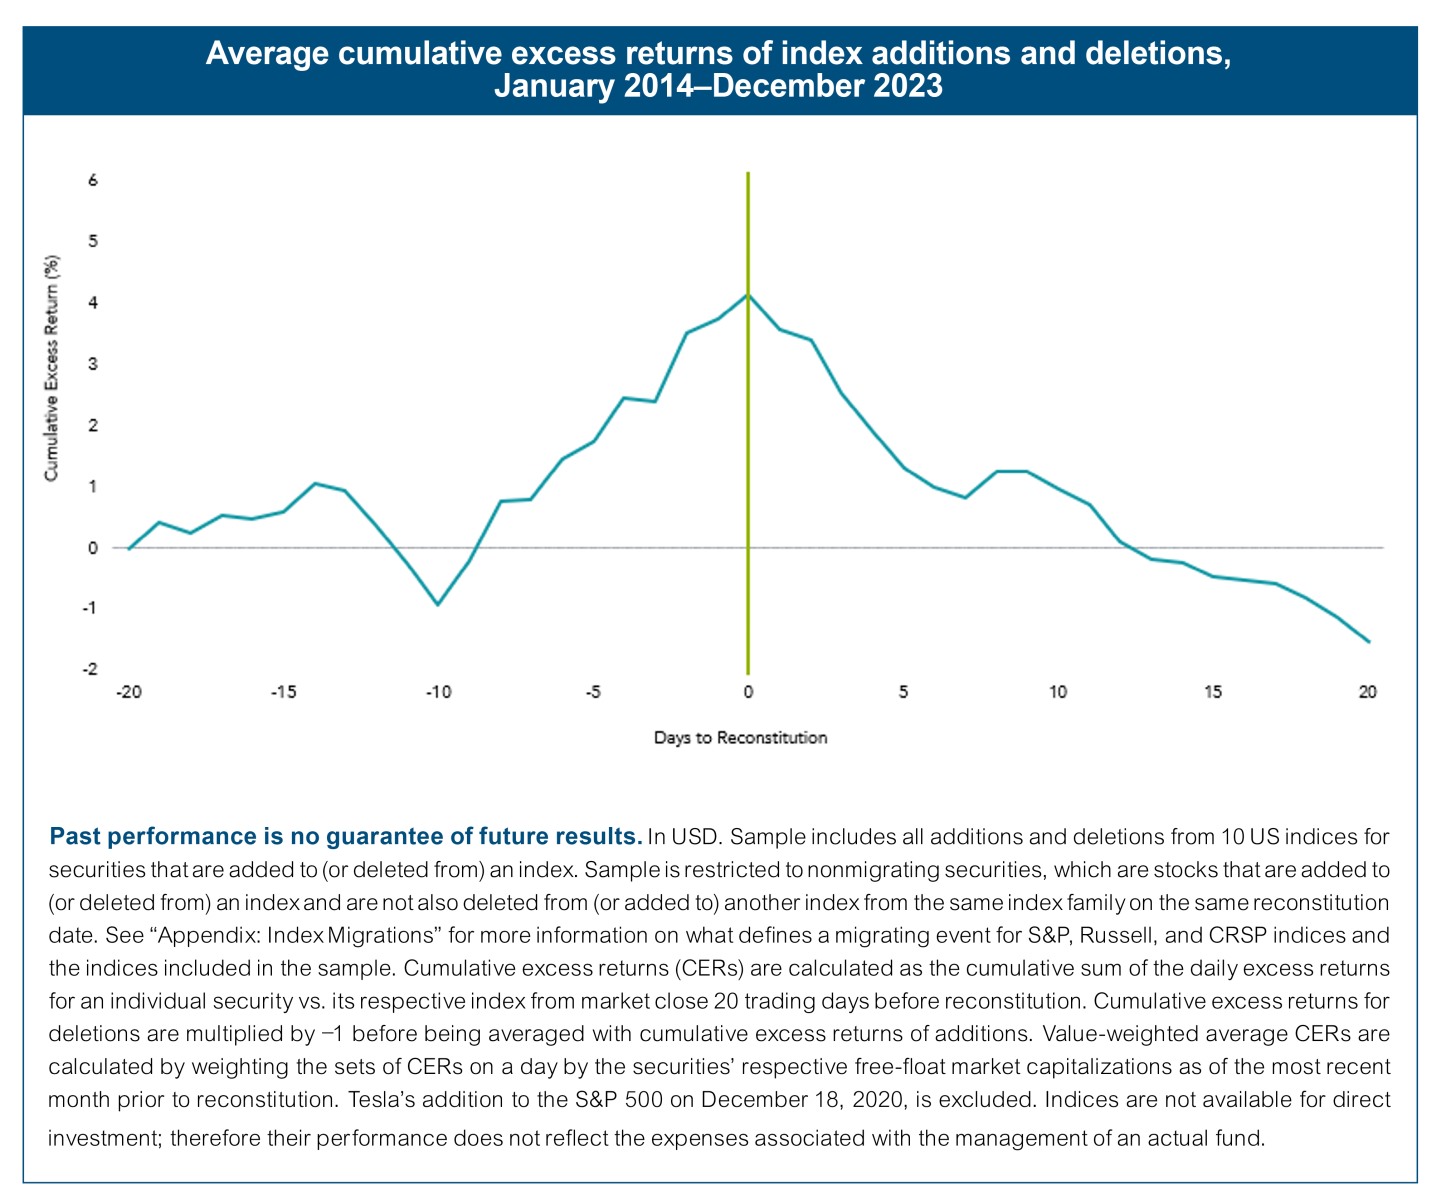
The highly regimented maintenance process indices periodically undergo leads to one of the more notable index fund drawbacks, and that’s the price impact during reconstitution events. Index providers tend to telegraph what changes are coming for their indices. Because the goal for index fund managers is to minimize tracking error, the market knows what they’re going to do and when they’re going to do it. When that’s the case, your execution is likely to suffer. Accordingly, the data show spikes in trade volume for securities being added to, or deleted from, indices, with commensurate impact on security prices. The result is index funds buying high and selling low—not a recipe for increasing expected return.
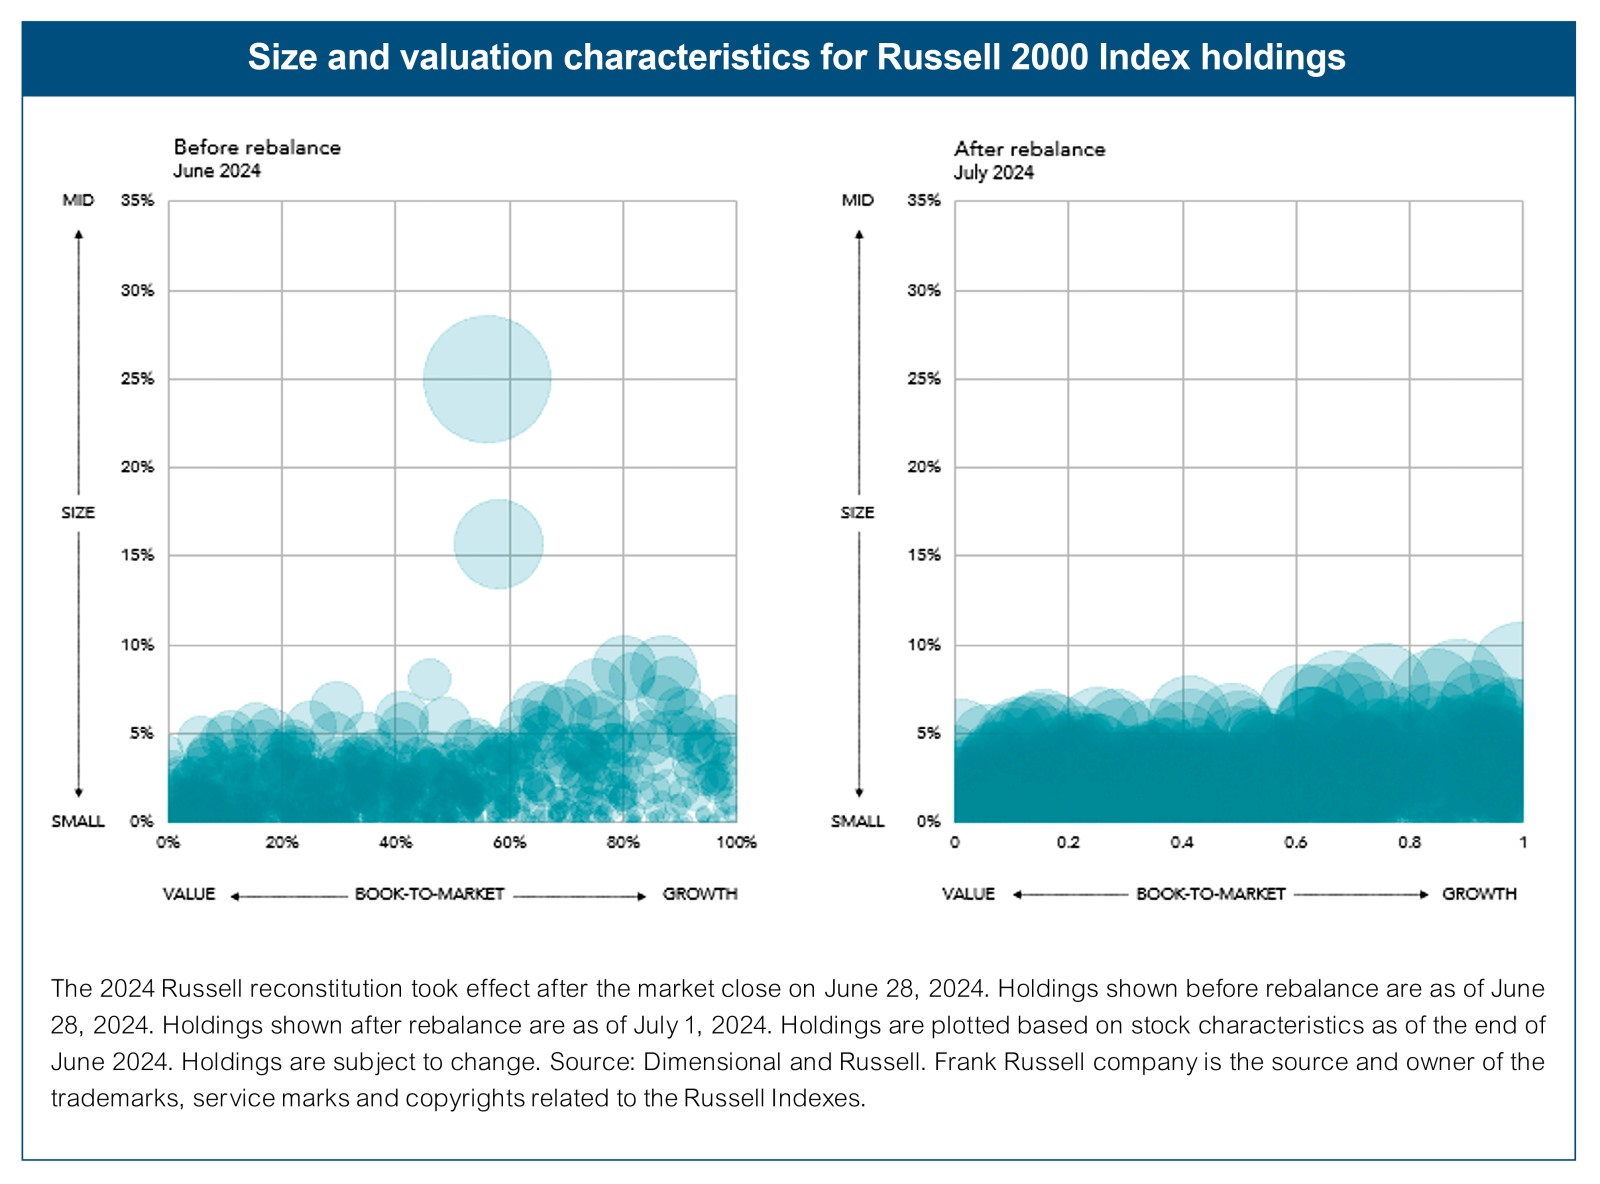
Infrequent rebalancing can also cause style drift. Market prices change every day, which means stock characteristics, such as market capitalization or price-to-earnings, continually vary. Between rebalancing events, stocks in the index may transition away from the intended asset class. At the same time, stocks may have moved into the asset class but may not be included in the index until the next rebalance date. It’s a bit like brushing your teeth once per year for several hours rather than every day for a few minutes.
A small cap index helps demonstrate the potential cost of style drift. After all, many investors seek higher returns through an allocation to small cap funds. But a small cap index fund that’s holding large caps may cost investors some of the expected outperformance for small vs. large stocks.
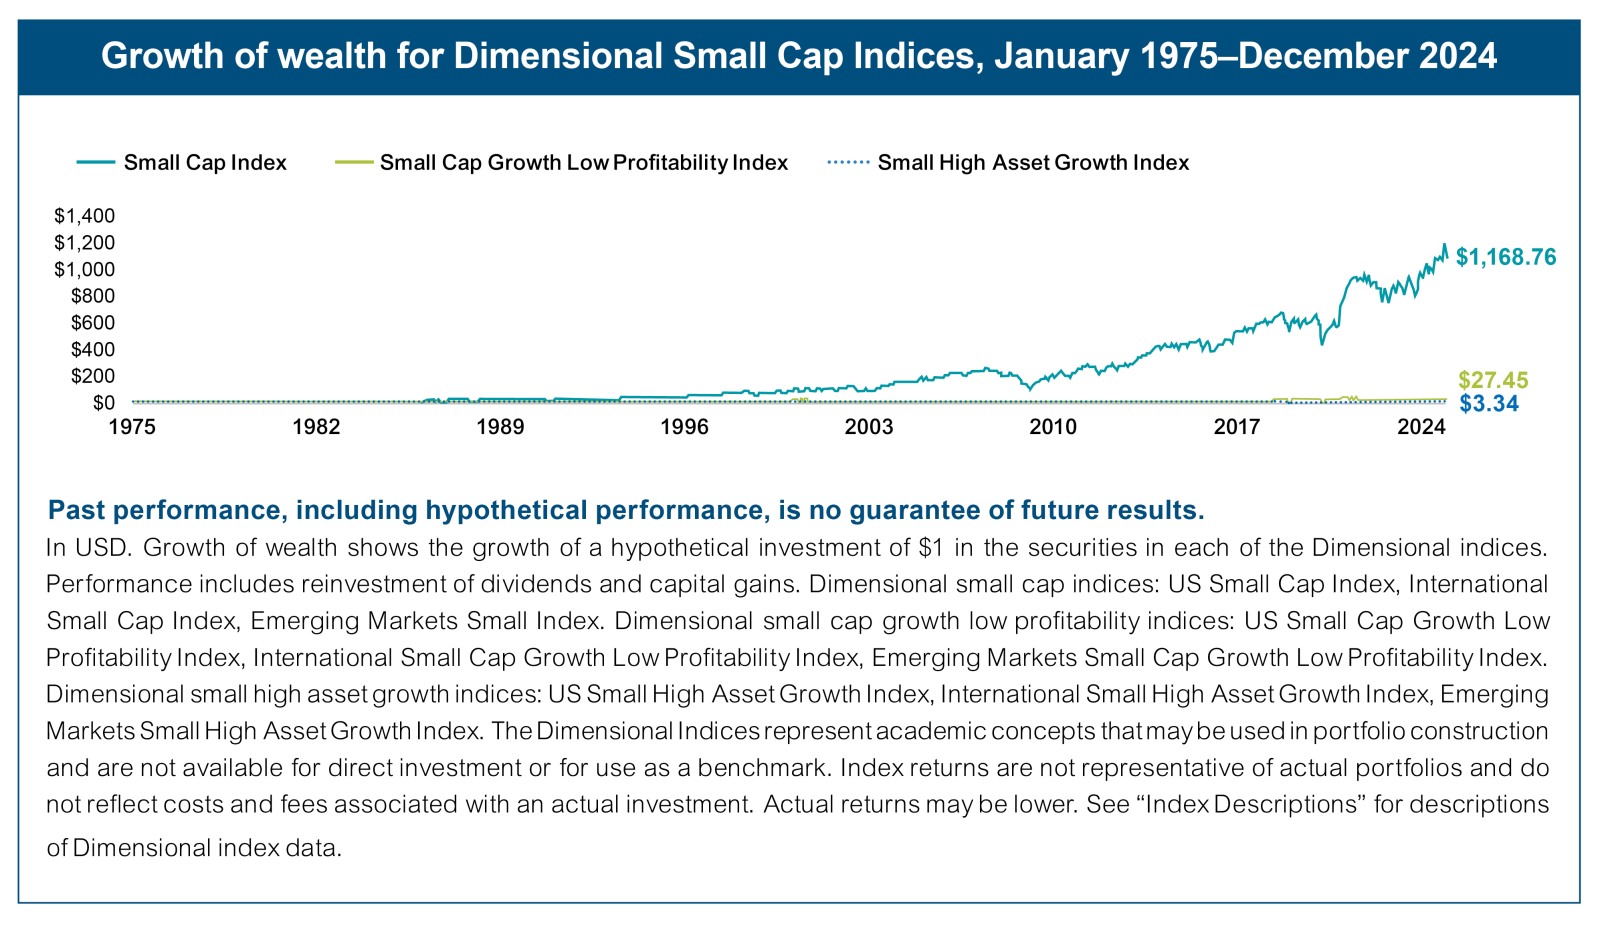
 Index funds may also hold stocks with lower expected returns. For example, research shows that stocks of small companies with low profitability or high asset growth underperform the broader small cap market. These stocks account for a significant chunk of many index funds and often drag down their performance.
Index funds have benefited the industry over the past few decades. A rules-based approach may provide more reliable outcomes than traditional active methods, may be more cost-effective, and may be easier to monitor and evaluate. Where index funds may leave money on the table is the lack of flexibility. A rules-based active investment approach with flexibility can add value by excluding low expected return stocks and rebalancing a little each day to seek more consistent asset class positioning and better execution costs.
Glossary
Profitability: A company’s operating income before depreciation and amortization minus interest expense scaled by book equity.
Style Drift: When an investor's portfolio deviates over time from its investment objective or targeted asset category.
Appendix: Index Migrations
S&P
S&P 500: Additions (deletions) that are deleted from (added to) the S&P 400 or S&P 600 indices
S&P 400: Additions (deletions) that are deleted from (added to) the S&P 500 or S&P 600 indices
S&P 600: Additions (deletions) that are deleted from (added to) the S&P 400 or S&P 500 indices
Russell
Russell 2000: Additions (deletions) that are deleted from (added to) the Russell 1000 Growth or Russell 1000 Value indices
Russell 1000 Growth: Additions (deletions) that are deleted from (added to) the Russell 2000 or Russell 1000 Value indices (or weight adjusted in Russell 1000 Value Index)
Russell 1000 Value: Additions (deletions) that are deleted from (added to) the Russell 2000 or Russell 1000 Growth indices (or weight adjusted in Russell 1000 Growth Index)
CRSP
CRSP US Large Cap Growth: Additions (deletions) that are deleted from (added to) the CRSP US Small Cap or CRSP US Large Cap Value indices (or weights adjusted in either index)
CRSP US Large Cap Value: Additions (deletions) that are deleted from (added to) the CRSP US Small Cap or CRSP US Large Cap Growth indices (or weights adjusted in either index)
CRSP US Mid Cap: Additions (deletions) that are deleted from (added to) the CRSP US Small Cap Index (or weight adjusted in the CRSP US Small Cap Index)
CRSP US Small Cap: Additions (deletions) that are deleted from (added to) the CRSP US Large Cap Growth, CRSP US Large Cap Value, or CRSP US Mid Cap indices (or weights adjusted in either index)
Index Descriptions
Dimensional US Small Cap Index was created by Dimensional in March 2007 and is compiled by Dimensional. It represents a market-capitalization-weighted index of securities of the smallest US companies whose market capitalization falls in the lowest 8% of the total market capitalization of the eligible market. The eligible market is composed of securities of US companies traded on the NYSE, NYSE MKT (formerly AMEX), and Nasdaq Global Market. Exclusions: non-US companies, REITs, UITs, and investment companies. From January 1975 to the present, the index excludes companies with the lowest profitability and highest relative price within the small cap universe. The index also excludes those companies with the highest asset growth within the small cap universe. Profitability is measured as operating income before depreciation and amortization minus interest expense scaled by book. Asset growth is defined as change in total assets from the prior fiscal year to current fiscal year. Source: CRSP and Compustat. The index monthly returns are computed as the simple average of the monthly returns of 12 subindices, each one reconstituted once a year at the end of a different month of the year. The calculation methodology for the Dimensional US Small Cap Index was amended on January 1, 2014, to include profitability as a factor in selecting securities for inclusion in the index. The calculation methodology for the index was amended in December 2019 to include asset growth as a factor in selecting securities for inclusion in the index.
Dimensional International Small Cap Index was created by Dimensional in April 2008 and is compiled by Dimensional. July 1981–December 1993: It Includes non-US developed securities in the bottom 10% of market capitalization in each eligible country. All securities are market capitalization weighted. Each country is capped at 50%. Rebalanced semiannually. January 1994–present: Market-capitalization-weighted index of small company securities in the eligible markets, excluding those with the lowest profitability and highest relative price within their country's small cap universe. The index also excludes those companies with the highest asset growth within their country’s small cap universe. Profitability is measured as operating income before depreciation and amortization minus interest expense scaled by book. Asset growth is defined as change in total assets from the prior fiscal year to current fiscal year. The index monthly returns are computed as the simple average of the monthly returns of four subindices, each one reconstituted once a year at the end of a different quarter of the year. Prior to July 1981, the index is 50% UK and 50% Japan. The calculation methodology for the Dimensional International Small Cap Index was amended on January 1, 2014, to include profitability as a factor in selecting securities for inclusion in the index. The calculation methodology for the index was amended in December 2019 to include asset growth as a factor in selecting securities for inclusion in the index.
Dimensional US Small Cap Growth Low Profitability Index was created in February 2016 and is compiled by Dimensional. January 1975–present: Consists of small cap securities in the eligible markets with the lowest profitability and highest relative price within their country’s small cap universe, after the exclusion of utilities and companies with either negative or missing relative price data. Profitability is defined as operating income before depreciation and amortization minus interest expense divided by book equity. The Eligible Market is composed of securities of US companies traded on the NYSE, NYSE MKT (formerly AMEX), and Nasdaq Global Market. Exclusions: Non-US companies, REITs, UITs, and Investment Companies Source: CRSP and Compustat. The index monthly returns are computed as the simple average of the monthly returns of 12 subindices, each one reconstituted once a year at the end of each month of the year.
Dimensional International Small Cap Growth Low Profitability Index was created in February 2016. January 1990–present: Consists of small cap securities in the eligible markets with the lowest profitability and highest relative price within their country’s small cap universe, after the exclusion of utilities and companies with either negative or missing relative price data. Profitability is defined as operating income before depreciation and amortization minus interest expense divided by book equity. The index monthly returns are computed as the simple average of the monthly returns of four sub-indices, each one reconstituted once a year at the end of each quarter of the year. Countries currently included are Australia, Austria, Belgium, Canada, Denmark, Finland, France, Germany, Hong Kong, Ireland, Italy, Japan, Netherlands, New Zealand, Norway, Singapore, Spain, Sweden, Switzerland, and United Kingdom. Exclusions: REITs and Investment Companies Source: Bloomberg.
Dimensional Emerging Markets Small Cap Growth Low Profitability Index was created by Dimensional in April 2019 and is compiled by Dimensional. January 1994–present: Consists of small cap securities in the eligible markets with the lowest profitability and highest relative price within their country’s small cap universe, after the exclusion of utilities and companies with either negative or missing relative price data. Profitability is defined as operating income before depreciation and amortization minus interest expense divided by book equity. The index monthly returns are computed as the simple average of the monthly returns of four sub-indices, each one reconstituted once a year at the end of each quarter of the year. Countries currently included are Brazil, Chile, China, Colombia, Czech Republic, Hungary, India, Indonesia, Malaysia, Mexico, Peru, Philippines, Poland, South Africa, South Korea, Taiwan, Thailand, and Turkey. Exclusions: REITs and Investment Companies Source: Bloomberg.
Dimensional US Small High Asset Growth Index was created by Dimensional in December 2019 and is compiled by Dimensional. January 1975–present: Consists of small cap securities in the eligible markets with the highest asset growth within their country’s small cap universe. Asset growth is defined as change in total assets from the prior fiscal year to current fiscal year. The Eligible Market is composed of securities of US companies traded on the NYSE, NYSE MKT (formerly AMEX), and Nasdaq Global Market. Exclusions: Non-US companies, REITs, UITs, and Investment Companies. Profitability is defined as operating income before depreciation and amortization minus interest expense divided by book equity. Source: CRSP and Compustat. The index monthly returns are computed as the simple average of the monthly returns of 12 subindices, each one reconstituted once a year at the end of each month of the year.
Dimensional International Small High Asset Growth Index was created by Dimensional in November 2019 and is compiled by Dimensional. January 1990 - Present: Consists of small cap securities in the eligible markets with the highest asset growth within their country’s small cap universe. Asset growth is defined as change in total assets from the prior fiscal year to current fiscal year. The index monthly returns are computed as the simple average of the monthly returns of four sub-indices, each one reconstituted once a year at the end of each quarter of the year. Countries currently included are Australia, Austria, Belgium, Canada, Denmark, Finland, France, Germany, Hong Kong, Ireland, Italy, Japan, Netherlands, New Zealand, Norway, Singapore, Spain, Sweden, Switzerland, and United Kingdom. Exclusions: REITs and Investment Companies Source: Bloomberg
Dimensional Emerging Markets Small High Asset Growth Index was created by Dimensional in November 2019 and is compiled by Dimensional. January 1990–present: Consists of small cap securities in the eligible markets with the highest asset growth within their country’s small cap universe. Asset growth is defined as change in total assets from the prior fiscal year to current fiscal year. The index monthly returns are computed as the simple average of the monthly returns of four sub-indices, each one reconstituted once a year at the end of each quarter of the year. Countries currently included are Argentina, Brazil, Chile, China, Colombia, Czech Republic, Hungary, India, Indonesia, Malaysia, Mexico, Peru, Philippines, Poland, South Africa, South Korea, Taiwan, Thailand, and Turkey. Exclusions: REITs and Investment Companies Source: Bloomberg.
Disclosures:
The information in this material is intended for the recipient’s background information and use only. It is provided in good faith and without any warranty or representation as to accuracy or completeness. Information and opinions presented in this material have been obtained or derived from sources believed by Dimensional to be reliable, and Dimensional has reasonable grounds to believe that all factual information herein is true as at the date of this material. It does not constitute investment advice, a recommendation, or an offer of any services or products for sale and is not intended to provide a sufficient basis on which to make an investment decision. Before acting on any information in this document, you should consider whether it is appropriate for your particular circumstances and, if appropriate, seek professional advice. It is the responsibility of any persons wishing to make a purchase to inform themselves of and observe all applicable laws and regulations. Unauthorized reproduction or transmission of this material is strictly prohibited. Dimensional accepts no responsibility for loss arising from the use of the information contained herein.
This material is not directed at any person in any jurisdiction where the availability of this material is prohibited or would subject Dimensional or its products or services to any registration, licensing, or other such legal requirements within the jurisdiction.
“Dimensional” refers to the Dimensional separate but affiliated entities generally, rather than to one particular entity. These entities are Dimensional Fund Advisors LP, Dimensional Fund Advisors Ltd., Dimensional Ireland Limited, DFA Australia Limited, Dimensional Fund Advisors Canada ULC, Dimensional Fund Advisors Pte. Ltd., Dimensional Japan Ltd., and Dimensional Hong Kong Limited. Dimensional Hong Kong Limited is licensed by the Securities and Futures Commission to conduct Type 1 (dealing in securities) regulated activities only and does not provide asset management services.
RISKS
Investments involve risks. The investment return and principal value of an investment may fluctuate so that an investor’s shares, when redeemed, may be worth more or less than their original value. Past performance is not a guarantee of future results. There is no guarantee strategies will be successful.
Dimensional Fund Advisors LP is an investment advisor registered with the Securities and Exchange Commission.
Investment products: • Not FDIC Insured • Not Bank Guaranteed • May Lose Value
Dimensional Fund Advisors does not have any bank affiliates.