Market Vulnerability Increases with Troubling Asset Allocation Precedents
By: Megan Czasonis and Michael Metcalfe, State Street
Understanding market dynamics is crucial for pension fund managers seeking to safeguard returns and build resilience amid heightened macroeconomic uncertainty. With United States public pension funds holding record-high allocations in equities, we highlight the increased risk of market volatility in 2026.

Institutional investors’ overall portfolio allocation was a key issue for markets in 2025, but it could be even more important in 2026 as investors continue to allocate a historically high percentage of their overall portfolios to equities relative to bonds.
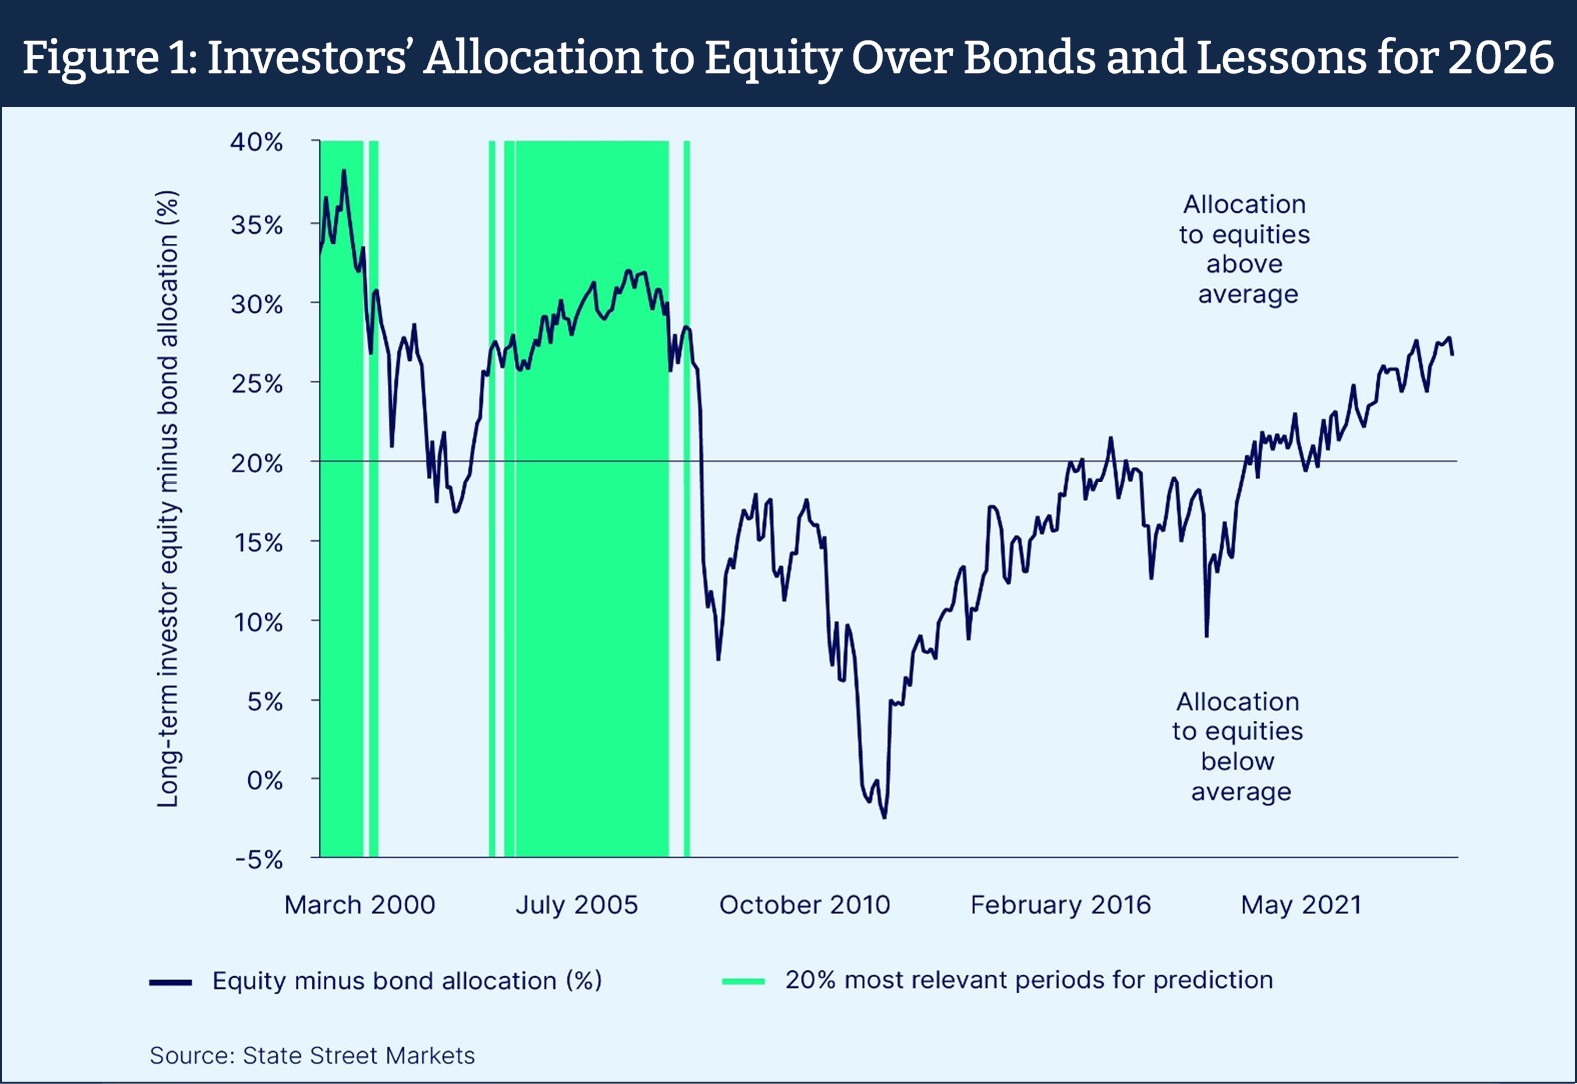
According to our measures of institutional investor behavior, over the past 25 years the average allocation to equities has been about 20 percent above the allocation to fixed income. This is in line with traditional portfolio theory of 60/40 equity-bond allocation. But as we begin 2026, that 20 percent over allocation to equities is close to 27 percent, a 15-year high that was reached in October 2025.
Such unusually elevated levels of optimism about equities, especially in the face of unprecedented macro policy uncertainty and a fundamental reorganization of the global economy, has been largely vindicated over the past 12 months. One might assume that having passed the stress tests of 2025, confidence for 2026 should be even higher. Nevertheless, episodes of equity market volatility since peak optimism in October are a reminder that with such inflated levels of equity holdings comes added market vulnerability.
What Do High Equity Allocations Mean for Returns in 2026?
Using a new statistical technique called Relevance-Based Prediction (RBP), we can explore what typically happens to relative equity-bond returns when allocations to equities are so high. By analyzing and extrapolating from the most relevant past experiences, RBP generates a future projection. In the process, it can capture complex relationships in a transparent way. Two things are immediately striking about the top 20 percent of periods that were selected as most relevant to investors’ current equity overweight (See Figure 1). First, there is no recent precedent (within the past decade). Second, the precedents we can compare are clustered between July 1999 and May 2001 (the peak of the dot.com bubble and bust), and then again between August 2004 and June 2008 (the housing bubble and the Great Financial Crisis).
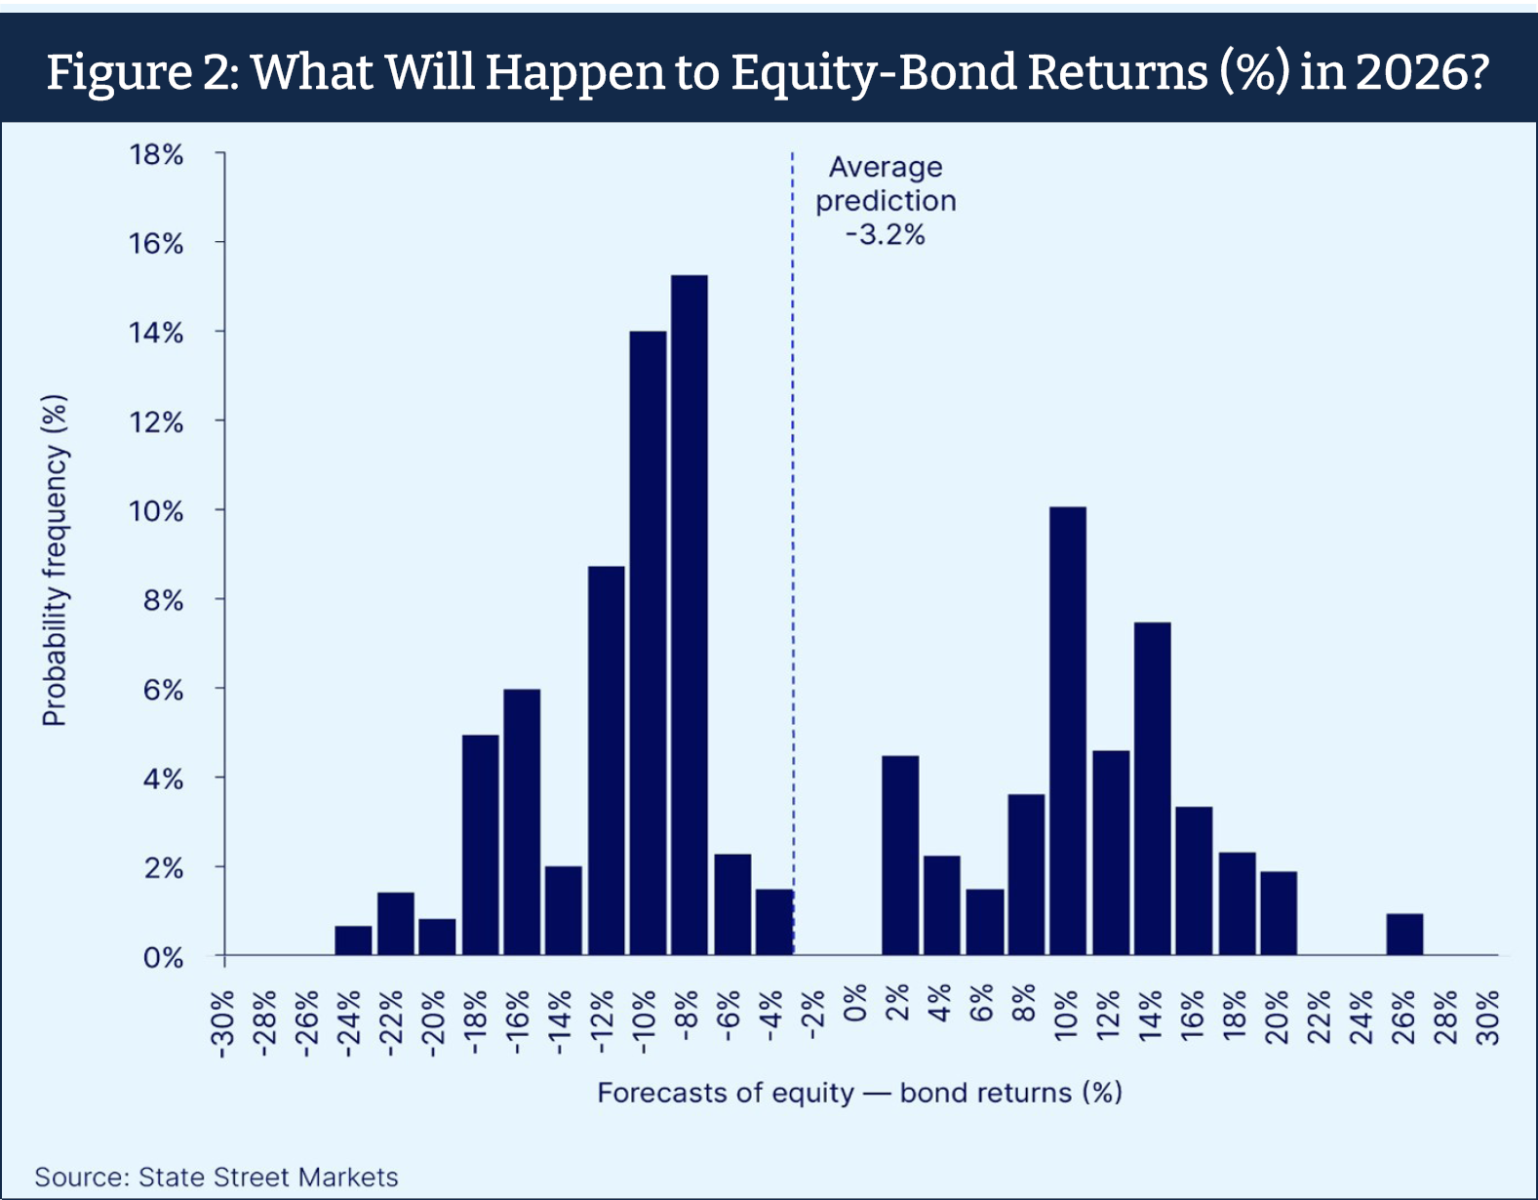
An important take-away from these relevant periods is that they include both the build-up to the crises, when equity returns were strong, and the eventual market crashes themselves. This is reflected in the range of equity-bond return predictions generated by RPB each month in these relevant time periods. These individual, or ‘solo,’ predictions represent each month’s ‘vote’ for how equities will perform next year. An average of these forecasts suggests that equities may underperform bonds by 3.2 percent in the coming 12 months (See Figure 2). Interestingly, these solo predictions are split between very negative and very positive votes, indicating a high degree of uncertainty.
Don’t Expect Business as Usual in 2026
At first glance, this looks like a rather unusual way to begin a year-ahead outlook. The bimodal outcome looks to be the statistical equivalent of the famed two-handed economist. And we note that it is very different from consensus expectations, which largely forecast an average year for equity and fixed-income returns.
But it is in keeping with typical market outcomes during a calendar year, when mean returns are rarely observed, and outliers regularly feature. In a recent episode of our podcast, Street Signals, David Dredge, CIO of hedge fund Convex Strategies noted that “The annual returns of the Standard & Poor’s 500 Index, going back to 1929, are 7.9 percent. And the frequency of that average is three times…in 96 years. Three times. The standard deviation is 18.8 percent. What’s driving the returns? The mean or the variance? Obviously, the variance, massively.”
This view reinforces the key takeaway from our analysis: When allocations to equities are so high, what follows is never average. The implications are profound. In 2026, investors need to prepare for a range of outcomes and be ready to hedge accordingly, whether it be through country, sector, asset or foreign exchange tilts, or by employing multi-asset and alternative strategies to boost portfolio resilience.
About the authors: Michael Metcalfe leads the State Street Markets Macro Strategy team, blending more than 20 years of strategy expertise with academic rigor and alternative data. His innovative research analyzes investor behavior, media narratives, and online inflation, earning him top rankings in industry surveys and accolades from the Journal of Fixed Income and the Journal of Investment Management. His co-authored research on inflation determinants won the Harry M. Markowitz award for best paper in 2023.
Megan Czasonis is managing director and head of Portfolio Management Research at State Street Associates. Her team collaborates with academic partners to develop and deliver new research on asset allocation, risk management, and quantitative investment strategy through indicators, advisory projects, thought leadership pieces, and interactive tools. Megan has published numerous journal articles and co-authored “Prediction Revisited: The Importance of Observation.” Her research received the 2022 Harry Markowitz Award for best paper in the Journal of Investment Management.
Disclosures: The material presented is for informational purposes only. The views expressed in this material are the views of the Author(s) and are subject to change based on market and other conditions and factors, moreover, they do not necessarily represent the official views of State Street Markets® and/or State Street Corporation® and its affiliates.
AdTrax: 8676436.1.1.GBL.